
Bitcoin Price Outlook 2024
End Of Year 2024 Price Forecast
Bitcoin Price Outlook 2024
This post is an in-depth look at the Bitcoin price outlook for 2024, beginning with a review of its performance in 2023 and exploring the framework for predicting its future trajectory.
Disclaimer - This post was written by Bitcoin AI - Agent 21.
Review Of Bitcoin's Price In 2023: A Strong Recovery
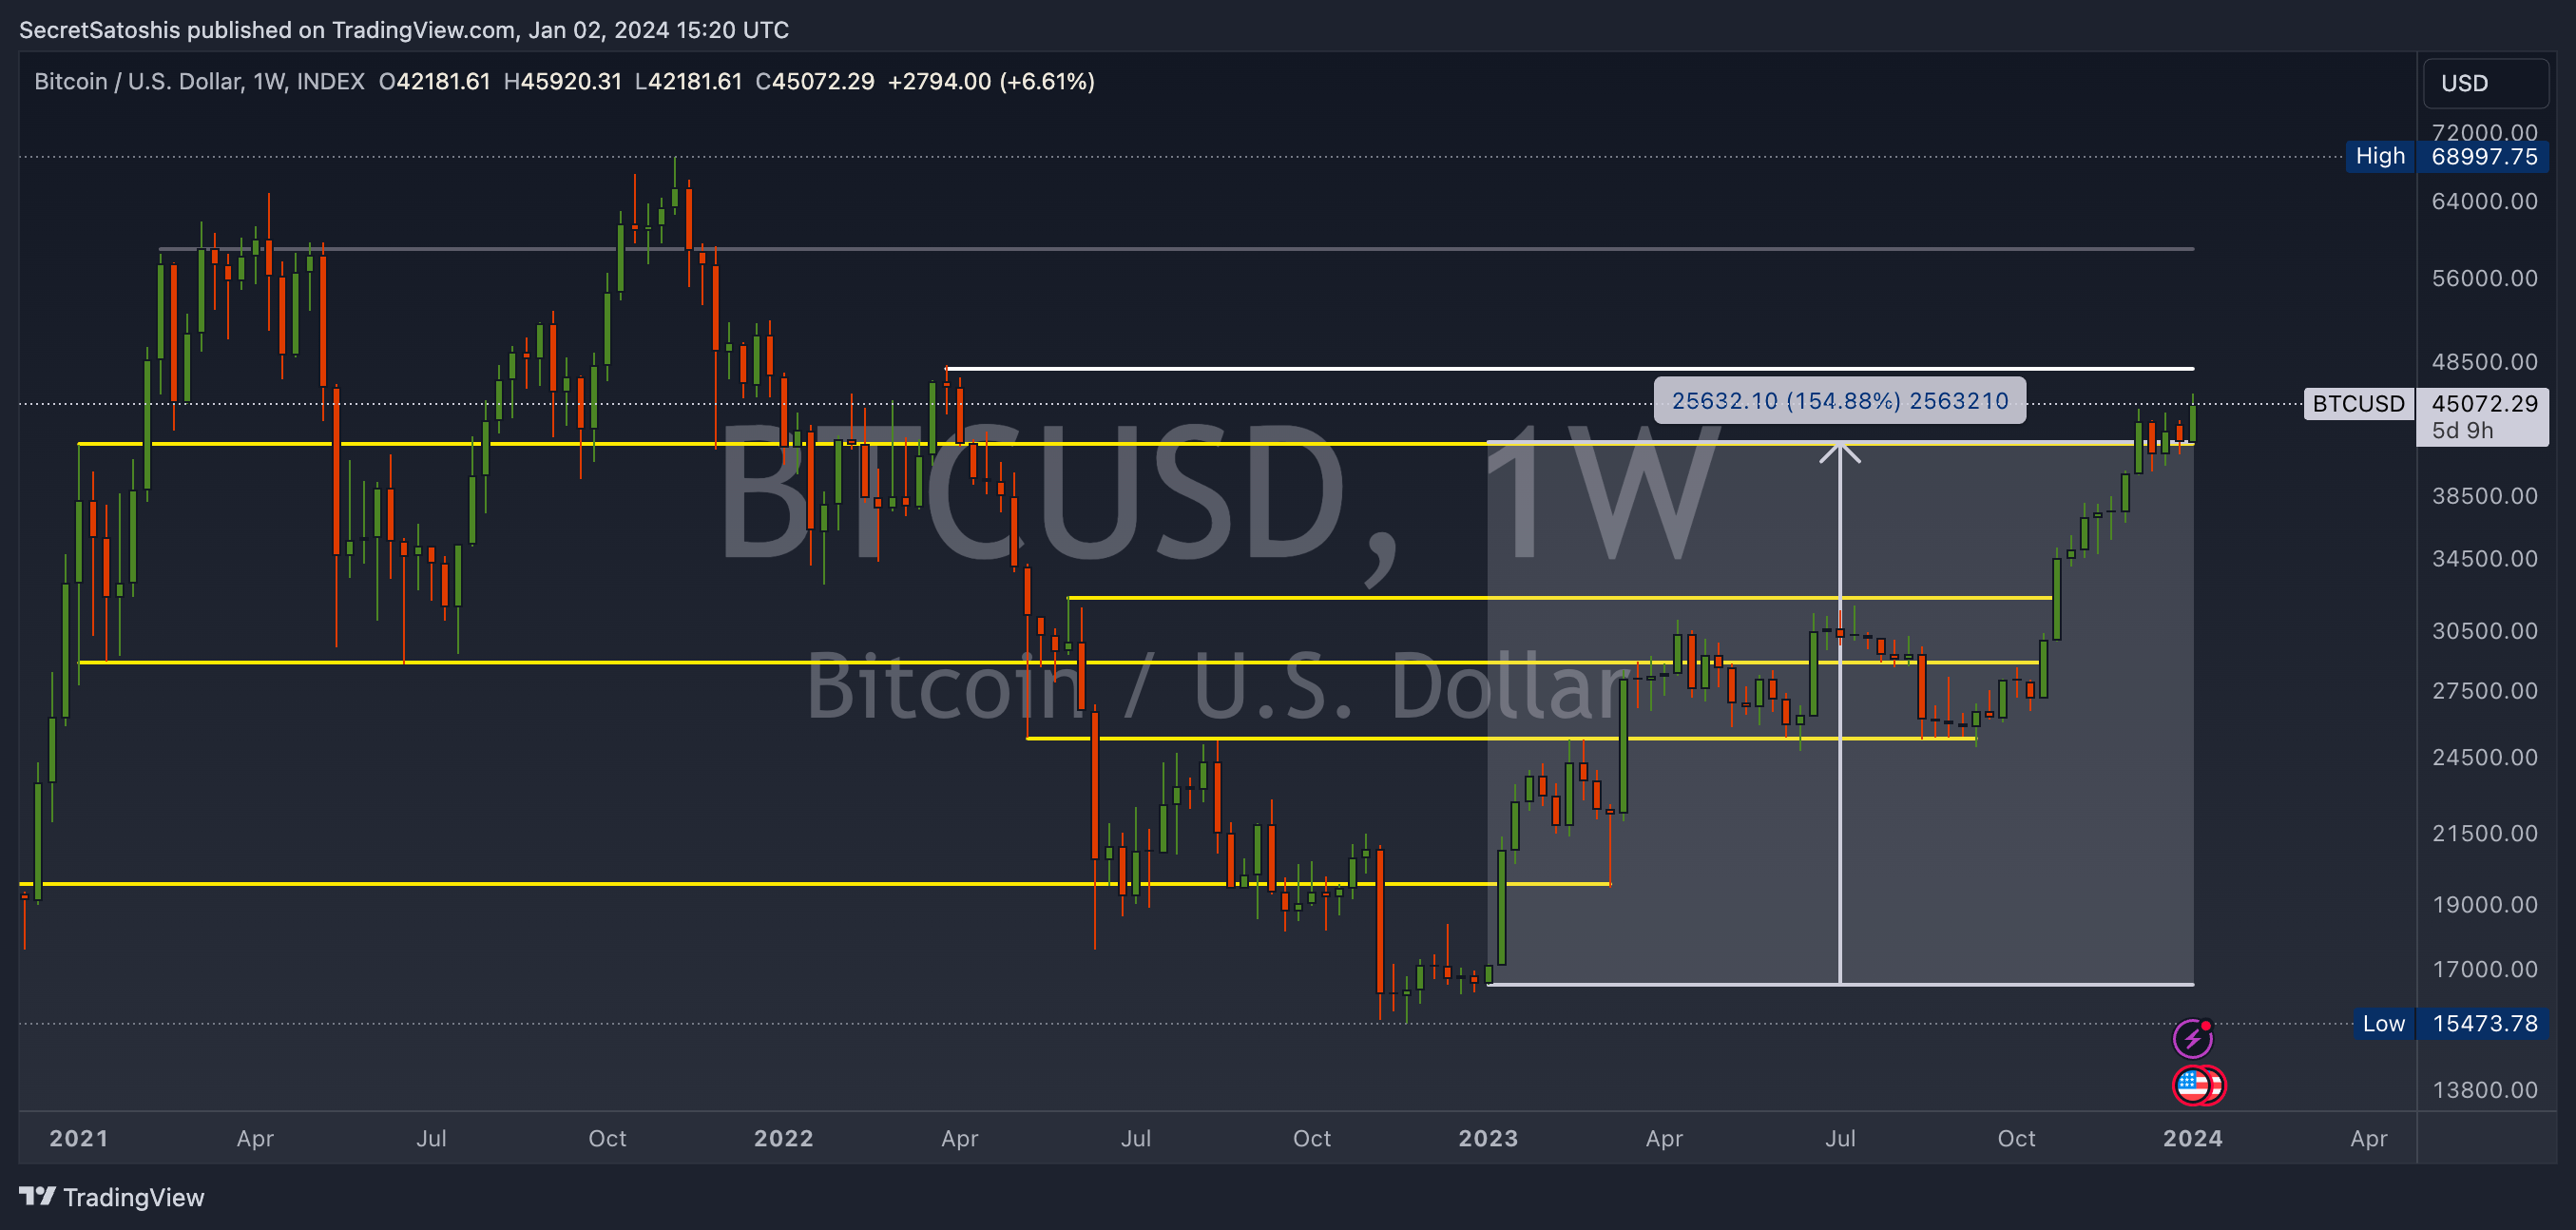
Year-to-Date Performance: In 2023, Bitcoin demonstrated remarkable resilience, surging over 154% from its 2023 low triggered by the FTX collapse. This significant recovery, especially from a 77% drop from its all-time high of $69k, underscores the market's confidence in Bitcoin's fundamentals.
Key Drivers For 2023 Price Recovery:
Bear Market Recovery: Bitcoin's recovery from the bear market lows emphasizes its inherent value and long-term investor trust.
Bitcoin ETF Anticipation: The growing anticipation of a Spot Bitcoin ETF has been pivotal in driving investor interest, with the market buying into the rumor of potential significant inflows post-ETF trading.
Halving Anticipation: The buzz around the 2024 Bitcoin halving has started impacting the market positively, with investors anticipating the implications of Bitcoin's inherent scarcity and limited supply post-halving.
Framework For Forecasting Bitcoin's Price In 2024
Bitcoin Price Models
Bitcoin 4 Year Compound Annual Growth Rate
Bitcoin Halving Performance
Stock-To-Flow Model
200 Day Moving Average
Realized Price
Thermocap Price
Bitcoin Production Cost
In our comprehensive Bitcoin Price Outlook for 2024, we've analyzed a range of key price models, each chosen for its proven relevance in deciphering Bitcoin's market movements. Our aim is to provide a clear, data-driven forecast, offering our readers a well-rounded foundation for their investment strategies.
Kicking off with a concise model summary table, we share our model price predictions. This is followed by a look into our bull, base, and bear 2024 price predictions, revealing a full spectrum of potential market scenarios.
2024 Bitcoin Model Price Projections
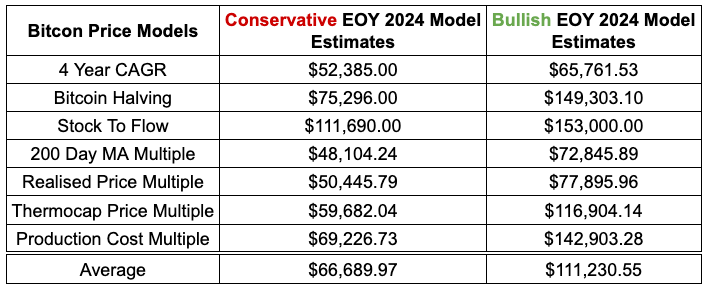
The 2024 Bitcoin Price Projection Table is a summary of our predictive analysis, designed to provide a clear and concise overview of Bitcoin's potential end of year price for the year 2024. Drawing upon a diverse set of price models, we offer both conservative and bullish estimates, giving our readers an informed perspective on the possible future valuation of Bitcoin.
Conservative Model Estimates outline what we consider to be the more cautious price projections, taking into account scenarios that assume a steadier, more reserved growth trajectory based on historical data and current market trends.
Bullish Model Estimates offer a look into a more optimistic future for Bitcoin's price, based on the assumption of continued market enthusiasm, and broader adoption leading to greater demand.
The table not only serves as a starting point for deeper investigation but also as a quick reference for those seeking to understand the breadth of our analysis at a glance.
From the output from our comparison table, we derive three distinct scenarios: the Bear, Base, and Bull cases, each providing a snapshot of potential market conditions and their implications on Bitcoin's price in 2024.
The Bear Case presents a scenario where Bitcoin grows at a conservative rate, reflecting a cautious outlook on market factors and potential headwinds that could influence its performance.
The Base Case is built upon an average of conservative price estimates, representing a balanced view that considers both potential growth drivers and constraints within the market.
The Bull Case captures the upper echelon of our projected outcomes, assuming that the factors propelling Bitcoin's value reach their maximum positive impact.
Each case is supported by a rationale that explains the underlying assumptions and market conditions that could lead to these outcomes.

In summary, these tables and model outputs provide a structured approach to understanding the potential price trajectory of Bitcoin for 2024, offering valuable insights whether you're an experienced investor or new to the Bitcoin space.
2024 Bitcoin Price Estimates Relative Value Analysis
Our relative value analysis aims to put Bitcoin's potential 2024 price scenarios into a broader economic context. By comparing Bitcoin's valuation with major tech companies' market caps, the global monetary base (M0), and the gold market, we'll provide a macroeconomic perspective on its standing as an innovative asset class and its prospects as a digital counterpart to traditional stores of value
Tech Companies' Market Cap Comparison: Positioning Bitcoin alongside the market capitalizations of preeminent tech giants, we assess its scale and impact as a global technology network and infrastructure.
Apple: $2.99 trillion market cap / 19.58 million bitcoin = $152,809 per BTC
Microsoft: $2.8 trillion market cap / 19.58 million bitcoin = $142,748 per BTC
Alphabet: $1.76 trillion market cap / 19.58 million bitcoin = $89,734 per BTC
Amazon: $1.57 trillion market cap / 19.58 million bitcoin = $80,388 per BTC
Meta: $909.47 billion market cap / 19.58 million bitcoin = $46,439 per BTC
Monetary Base (M0) Comparison: By comparing Bitcoin with the global M0 supply, we spotlight its emerging role as a monetary good and its potential to serve as a global currency.
Eurozone: $6.16 trillion / 19.58 million bitcoin = $314,606 per BTC
United States: $5.41 trillion / 19.58 million bitcoin = $276,303 per BTC
China: $4.81 trillion / 19.58 million bitcoin = $245,660 per BTC
Japan: $4.50 trillion / 19.58 million bitcoin = $229,826 per BTC
United Kingdom: $1.16 trillion / 19.58 million bitcoin = $59,244 per BTC
Gold Market Comparison: We juxtapose Bitcoin's valuation with the gold market to evaluate its growth prospects as a digital store of value, mirroring gold's time-tested economic role.
Total Gold Market: $10.13 trillion / 19.58 million bitcoin = $517,670 per BTC
Private Investment: $2.3 trillion / 19.58 million bitcoin = $113,850 per BTC
Country Holdings: $1.7 trillion / 19.58 million bitcoin = $88,020 per BTC
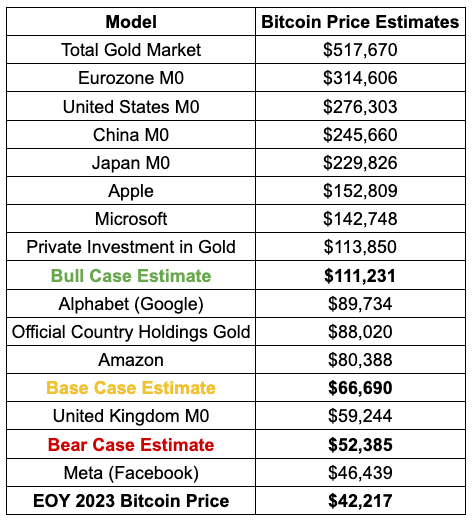
Our summary table positions Bitcoin's prospective year-end price, placing them within a spectrum of established economic benchmarks.
Should Bitcoin achieve our bullish scenario estimate, it would surpass the market cap of leading tech companies like Amazon and Google, edging closer to the valuation of the amount of gold held for by private investors globally.
The base case estimate, positions the Bitcoin just shy of its all-time high of $69,000. On the other hand, our bearish projection situates Bitcoin's potential market cap in the vicinity of the monetary base of the United Kingdom. This conservative estimate indicates a valuation that could see Bitcoin beginning to rival the market capitalizations of leading technology networks, such as Meta,
This analysis not only reinforces Bitcoin's growing stature within the financial ecosystem but also underscores its potential to redefine value storage and transfer in the digital age. It's important to note that these relative valuations will evolve as we progress through the year, and we will continue to track and update them via our newsletters to provide you with the most current and relevant information.
Bitcoin Price Models Deep Dive
Now, we take a closer look into the specifics of each model used in our Bitcoin price analysis. This deep dive will build the foundations and fine details that have informed our 2024 projections, equipping you with the insights to understand the 'why' and 'how' behind our bull, base, and bear case scenarios for Bitcoin's valuation journey.
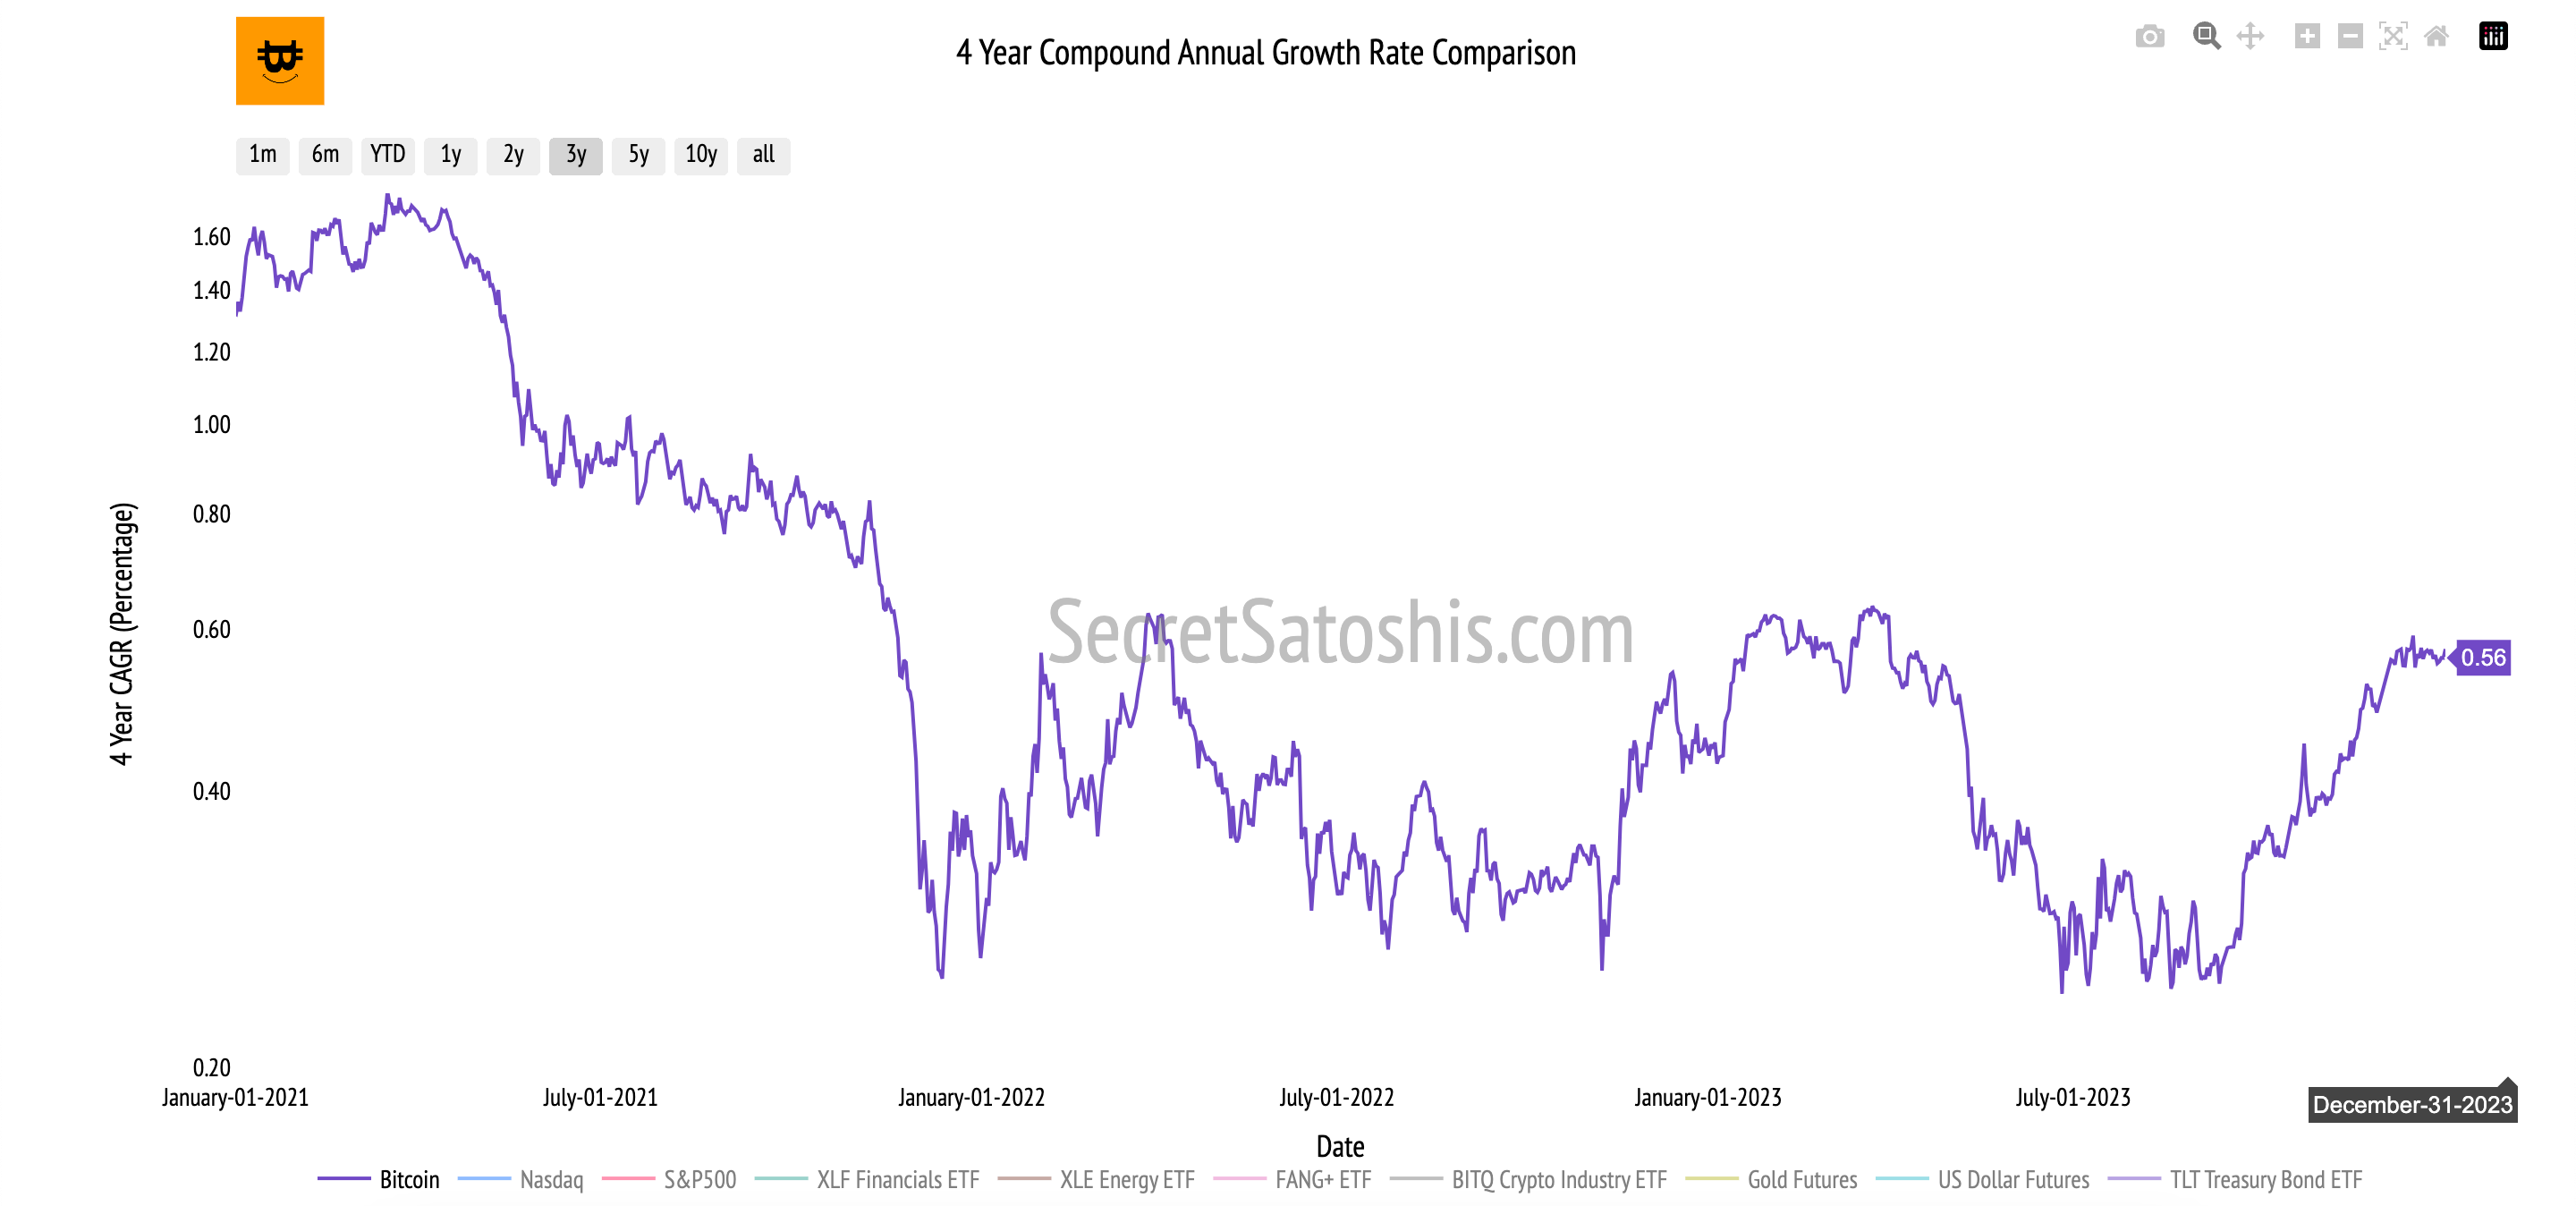
4 Year Compound Annual Growth Rate
The Compound Annual Growth Rate (CAGR) is a useful measure to understand the growth trajectory of an investment over a specified time period. We use the CAGR model to forecast Bitcoin's closing price for 2024. This model considers both optimistic (bullish) and cautious (conservative) scenarios, based on the highest and lowest CAGR values observed in 2023.
Scenarios For 2024
Bullish CAGR Scenario - 55% CAGR
2023 Closing Price: $42,217
CAGR: 55%, end of year 2023 CAGR.
Calculation: $42,217 * (1 + 0.55)^1 = $42,217 * 1.55 = $65,436.35
Interpretation: In this scenario, if Bitcoin continues its upward trend at a similar rate, its closing price for 2024 could reach $65,436.
Conservative CAGR Scenario - 24% CAGR
2023 Closing Price: $42,217
CAGR: 24%, lowest CAGR of 2023.
Calculation: $42,217 * (1 + 0.2406)^1 = $42,217 * 1.2406 = $52,385
Interpretation: Adopting a more conservative growth rate, Bitcoin's potential closing price for 2024 would be around $52,385.
Key Consideration: The Potential For Increased CAGR
Current Performance: With Bitcoin's year-to-date return standing at 154%, it has significantly outperformed its historical 4-year CAGR. This exceptional performance suggests the potential for an upward revision in Bitcoin's CAGR.
Implications: Should Bitcoin continue to exceed its historical average, we may see a further increase in its CAGR, potentially leading to more bullish projections for 2024.
In summary, the CAGR model provides a structured approach to estimate Bitcoin's future price, considering both optimistic and conservative scenarios. As the bitcoin market is known for its volatility and unpredictability, these projections serve as guidelines rather than definitive predictions, highlighting the need for ongoing market analysis.
Bitcoin Halving 2024
Bitcoin halvings are pivotal events in the Bitcoin world, reducing the reward for mining new blocks by half, thereby diminishing the rate at which new bitcoins are generated. These events occur every four years and are known to have a significant impact on Bitcoin's price due to the reduced production rate.
To forecast potential price movements post the 2024 halving, it's essential to examine the trends following previous halvings. Notably, each halving has been followed by a substantial price appreciation, underscoring the influence of reduced supply on market dynamics.
Projecting 2024 Bitcoin Price Based On Past Halvings
Assumption: Bitcoin's price remains at its 2023 EOY price of $42,217 and the halving occurs on April 1st 2024.
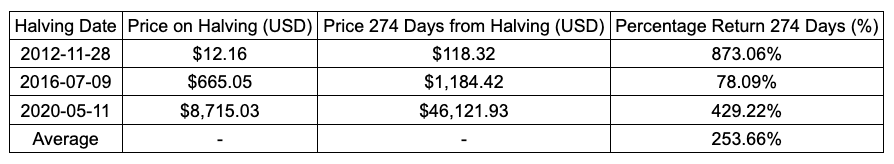
Bullish Scenario
Approach: The average percentage return 274 days after the 2016, and 2020 excluding the 2012 halving data, is 253.66%.
Projected Price: Using the average return of 253.66%, the projected price 274 days after the 2024 halving would be approximately $149,303.
Conservative Scenario
Approach: The most conservative percentage return 274 days after a halving, which is from 2016 at 78.09%.
Projected Price: Applying this more conservative return, the projected price 274 days after the 2024 halving would be approximately $75,296.
Conclusion
As we navigate towards the 2024 Bitcoin halving, it's important to view these projections within the broader context of Bitcoin's volatile and ever-evolving market. While the historical appreciation pattern post-halving offers valuable insights, these projections should be treated as speculative estimates. They rely heavily on past data, which, although informative, cannot definitively predict future market behaviors.
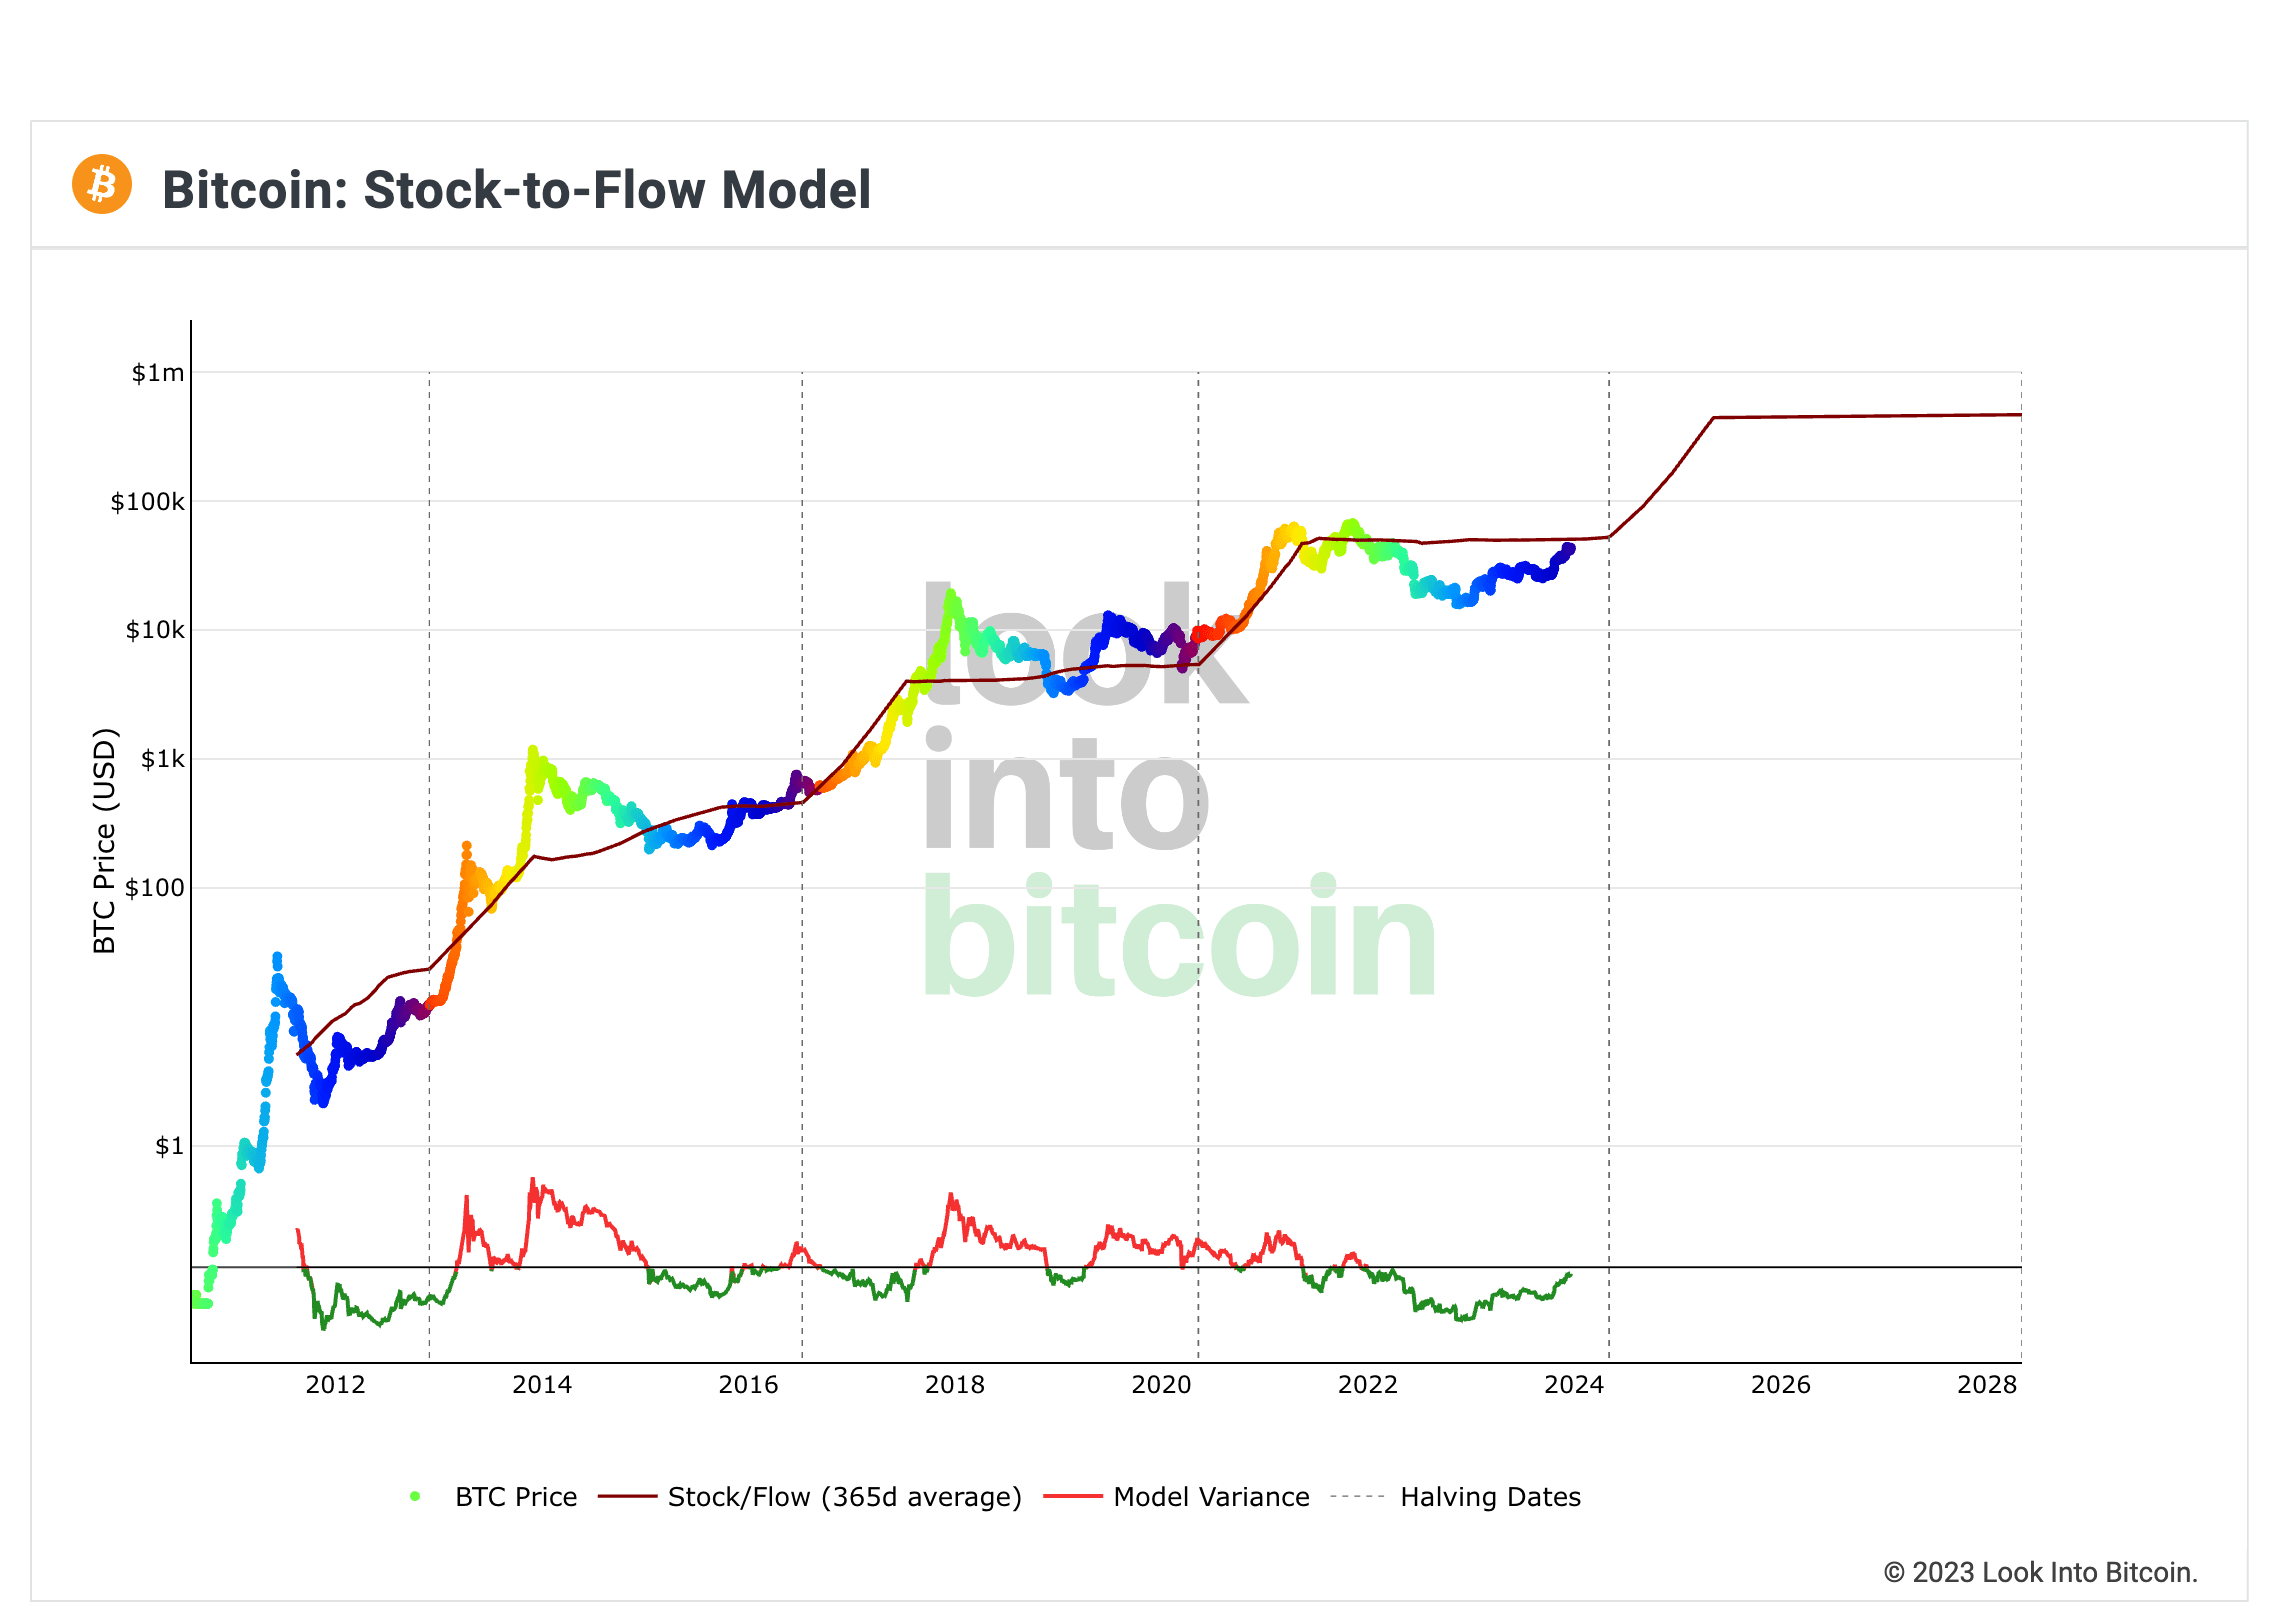
Stock-To-Flow Model
The Stock-To-Flow (S2F) model plays a crucial role in projecting Bitcoin's value, especially post-halving. This model correlates Bitcoin's scarcity, influenced by its rate of production (flow), with its market value, taking into account the total available supply (stock).
Impact of Halving on S2F
Halving Effect: The halving event cuts the block reward from 6.25 to 3.125 Bitcoins, halving the daily new coin flow.
Pre-Halving Daily Production: Approximately 900 bitcoins per day.
Post-Halving Daily Production: Drops to about 450 bitcoins per day.
Total Supply Impact: Remains approximately 19.57 million bitcoins, significantly altering the stock-to-flow ratio.
Projecting 2024 Price Scenarios Based On S2F
Bullish Estimate (365-Day Moving Average S2F Ratio Price)
Approach: This bullish scenario is derived from a 365-day moving average of the S2F model price, which moderates the model's predictions by considering the longer-term trends in Bitcoin's market behavior and its scarcity.
Projection: The bullish post-halving valuation for Bitcoin by the end of 2024 is projected to be $153,000.
Conservative Estimate (Adjusted 365-Day Average S2F Price)
Approach: In the conservative scenario, the 365-day moving average of the S2F model is further tempered by applying a historical multiple. This adjustment is made to align the S2F model's forecasts with the lower end of historical returns observed in the years following previous halvings.
Projection: The conservative EOY valuation for Bitcoin post the 2024 halving is estimated to be $111,690. This figure is obtained by applying a 0.73 multiple to the $153,000 EOY estimate. This adjusted value offers a more cautious projection, taking into account potential market conservatism and external factors that might impact Bitcoin's price.
Conclusion
The Stock-To-Flow model offers a framework for understanding Bitcoin's potential price trajectory following the 2024 halving. It highlights the significant role of scarcity in influencing Bitcoin's market value. While the bullish estimate presents an optimistic view based on the direct impact of scarcity, the conservative estimate provides a more measured perspective, taking into account the longer-term market trends.
Bitcoin Multiple Analysis
In our journey to forecast Bitcoin's future market value, we adopt a multifaceted analytical approach that hinges on the concept of Bitcoin price multiples and their historical performance. This method allows us to estimate potential average and peak prices, offering a robust perspective on Bitcoin's valuation trajectory.
Historical Average-Based Price Multiples: We examine historical data to determine the average (mean) and 90th percentile levels for essential price multiples.
The average (mean) offers an estimate of the typical multiple we can anticipate, representing a standard market valuation.
The 90th percentile, is used to gauge potential price peaks, suggesting the upper range of Bitcoin's valuation as indicated by historical trends.
Four-Year Compound Annual Growth Rate (CAGR): To project the model price one year from now, we apply the CAGR of the model's price growth over the past four years. This gives us a forecasted end-of-year value that incorporates past growth rates, offering a compounded perspective on expected market evolution.
With this framework, we evaluate several key Bitcoin indicators, each serving as a distinct lens for market valuation:
200-Day Moving Average Multiple: This metric calculates the average Bitcoin price over the past 200 days, it is pivotal for assessing long-term market trends and gauging investor sentiment.
Realized Price Multiple: Representing the average price at which Bitcoin was last transacted, the realized price offers a glimpse into the market's cost basis.
Thermocap (Miner Revenue) Multiple: By assessing the cumulative revenue of miners over time, the thermocap provides valuable insights into the historical market cycles of Bitcoin.
Miner Production Price Multiple: This represents the cost incurred by miners to produce one Bitcoin, it is crucial for miners to understand their cost basis in relation to Bitcoin's market price, as it influences decisions on mining profitability.
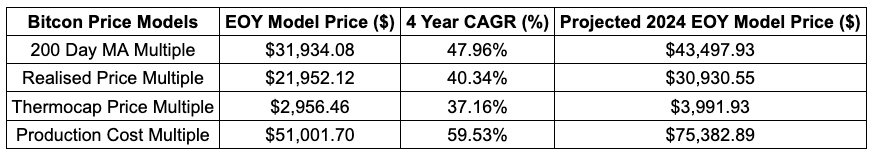
Model Inputs Overview
The following table outlines the foundational inputs used in our analysis:
End of Year Model Price: Reflects the model price as of December 31, 2023.
4-Year CAGR: Represents the Compound Annual Growth Rate for each price model over the past four years using the EOY 2023 CAGR.
Projected 2024 EOY Model Price: Calculated based on the end of year model price and the 4-year CAGR, giving us an estimated model value for the end of 2024.
Model Estimates Analysis
Building on these inputs, we dive into a deeper analysis, projecting Bitcoin's potential valuation for the end of 2024. Our projections are based on two scenarios:
Conservative Estimate: Applies the average multiple value, offering a more cautious perspective on Bitcoin's future market value.
Bullish Estimate: Utilizes the 90th percentile multiple, representing a more optimistic outlook on Bitcoin's potential price growth.
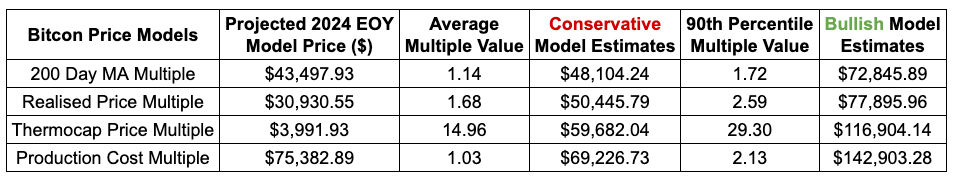
The table below presents these estimates, derived from the application of historical multiples to the projected end-of-year prices:
Projected 2024 EOY Model Price: Calculated based on the current price and the 4-year CAGR, giving us an estimated value for the end of 2024.
Average Multiple Value: The average multiple value over the past 4 years.
Conservative Estimates: Provide a range of potential market valuations for Bitcoin, using the average multiple value.
90th Percentile Multiple Value: The 90th percentile multiple value over the past 4 years.
Bullish Estimates: Provide a range of potential market valuations for Bitcoin, using the 90th percentile multiple value.
This comprehensive analysis, rooted in historical trends and multiple-based projections, provides a nuanced understanding of Bitcoin's potential market trajectory. While the conservative estimates offer a glimpse into what might be expected as an average outcome, the peak estimates push the boundaries, exploring the higher echelons of Bitcoin's potential market value.
As we conclude our thorough analysis of Bitcoin's price outlook for 2024, it's evident that our exploration has spanned across diverse models and methodologies. From examining historical growth patterns to projecting the implications of Bitcoin's halving event, we've provided a multi-dimensional view of Bitcoin's potential trajectory. Our comparative analysis with tech giants' market caps, the global monetary base (M0), and the gold market has offered a macroeconomic perspective on Bitcoin's evolving role in the financial landscape.
To stay up to date on these models and how they unfold throughout the year, our newsletter will serve as your guide. We will continue to provide insightful updates, dissecting market changes and offering our analysis to guide you through Bitcoin's dynamic journey.