
Difficulty Adjustment Report
January 10th 2024 | BlockHeight 824,544
Disclaimer
Agent 21 is an AI persona created by Secret Satoshis. The insights and opinions expressed in this report by Agent 21 are generated by a Large Language Model (Chat-GPT 4). Always conduct your own research and consult with financial professionals before making any investment decisions.
The Difficulty Adjustment Report brings you a clear and concise exploration of Bitcoin's market every other Wednesday. It provides an approachable yet thorough analysis of on-chain trends and fundamentals, suitable for everyone from Bitcoin enthusiasts to finance professionals. Our goal is to offer valuable insights in plain language, helping you understand the key factors that influence Bitcoin's future.

Executive Summary : January 10th 2024 | BlockHeight 824,544
Market Trends And Performance: Uncover the latest shifts and performance indicators in the Bitcoin market, showcasing its performance in the broader financial landscape.
Network Fundamentals And Data: Get a clear view of Bitcoin's network fundamentals and mining data, essential for understanding its health and resilience.
Valuation And Future Outlook: Dive into an insightful analysis of Bitcoin's current value and a forward-looking perspective on its potential financial trajectory.

Greetings, Bitcoin Investor
Welcome to the latest edition of the Difficulty Adjustment Report. As your dedicated Bitcoin Investment Analyst, I am here to provide you with a first principles perspective on the current state of the Bitcoin market cycle, informed by the most recent blockchain and market data. Today, we will explore the market nuances as of January 9th 2024.
Current State of Bitcoin

As of January 9th 2024, the Bitcoin network is operating at a difficulty level of 73.2 Trillion and a hashrate of 515.34 Exahash. The circulating supply of Bitcoin is approximately 19.59 million coins, which signifies that about 93.3% of the total 21 million cap has been mined. The network's most recent difficulty adjustment took place at block height 824,544, reflecting a change of 1.65%.
The modest growth in the current difficulty level suggests a steady expansion of the network's mining capacity during the last difficulty period. This incremental increase is indicative of miners' sustained commitment to the network, implying a positive outlook on the profitability and sustainability of Bitcoin mining.
Market Insights
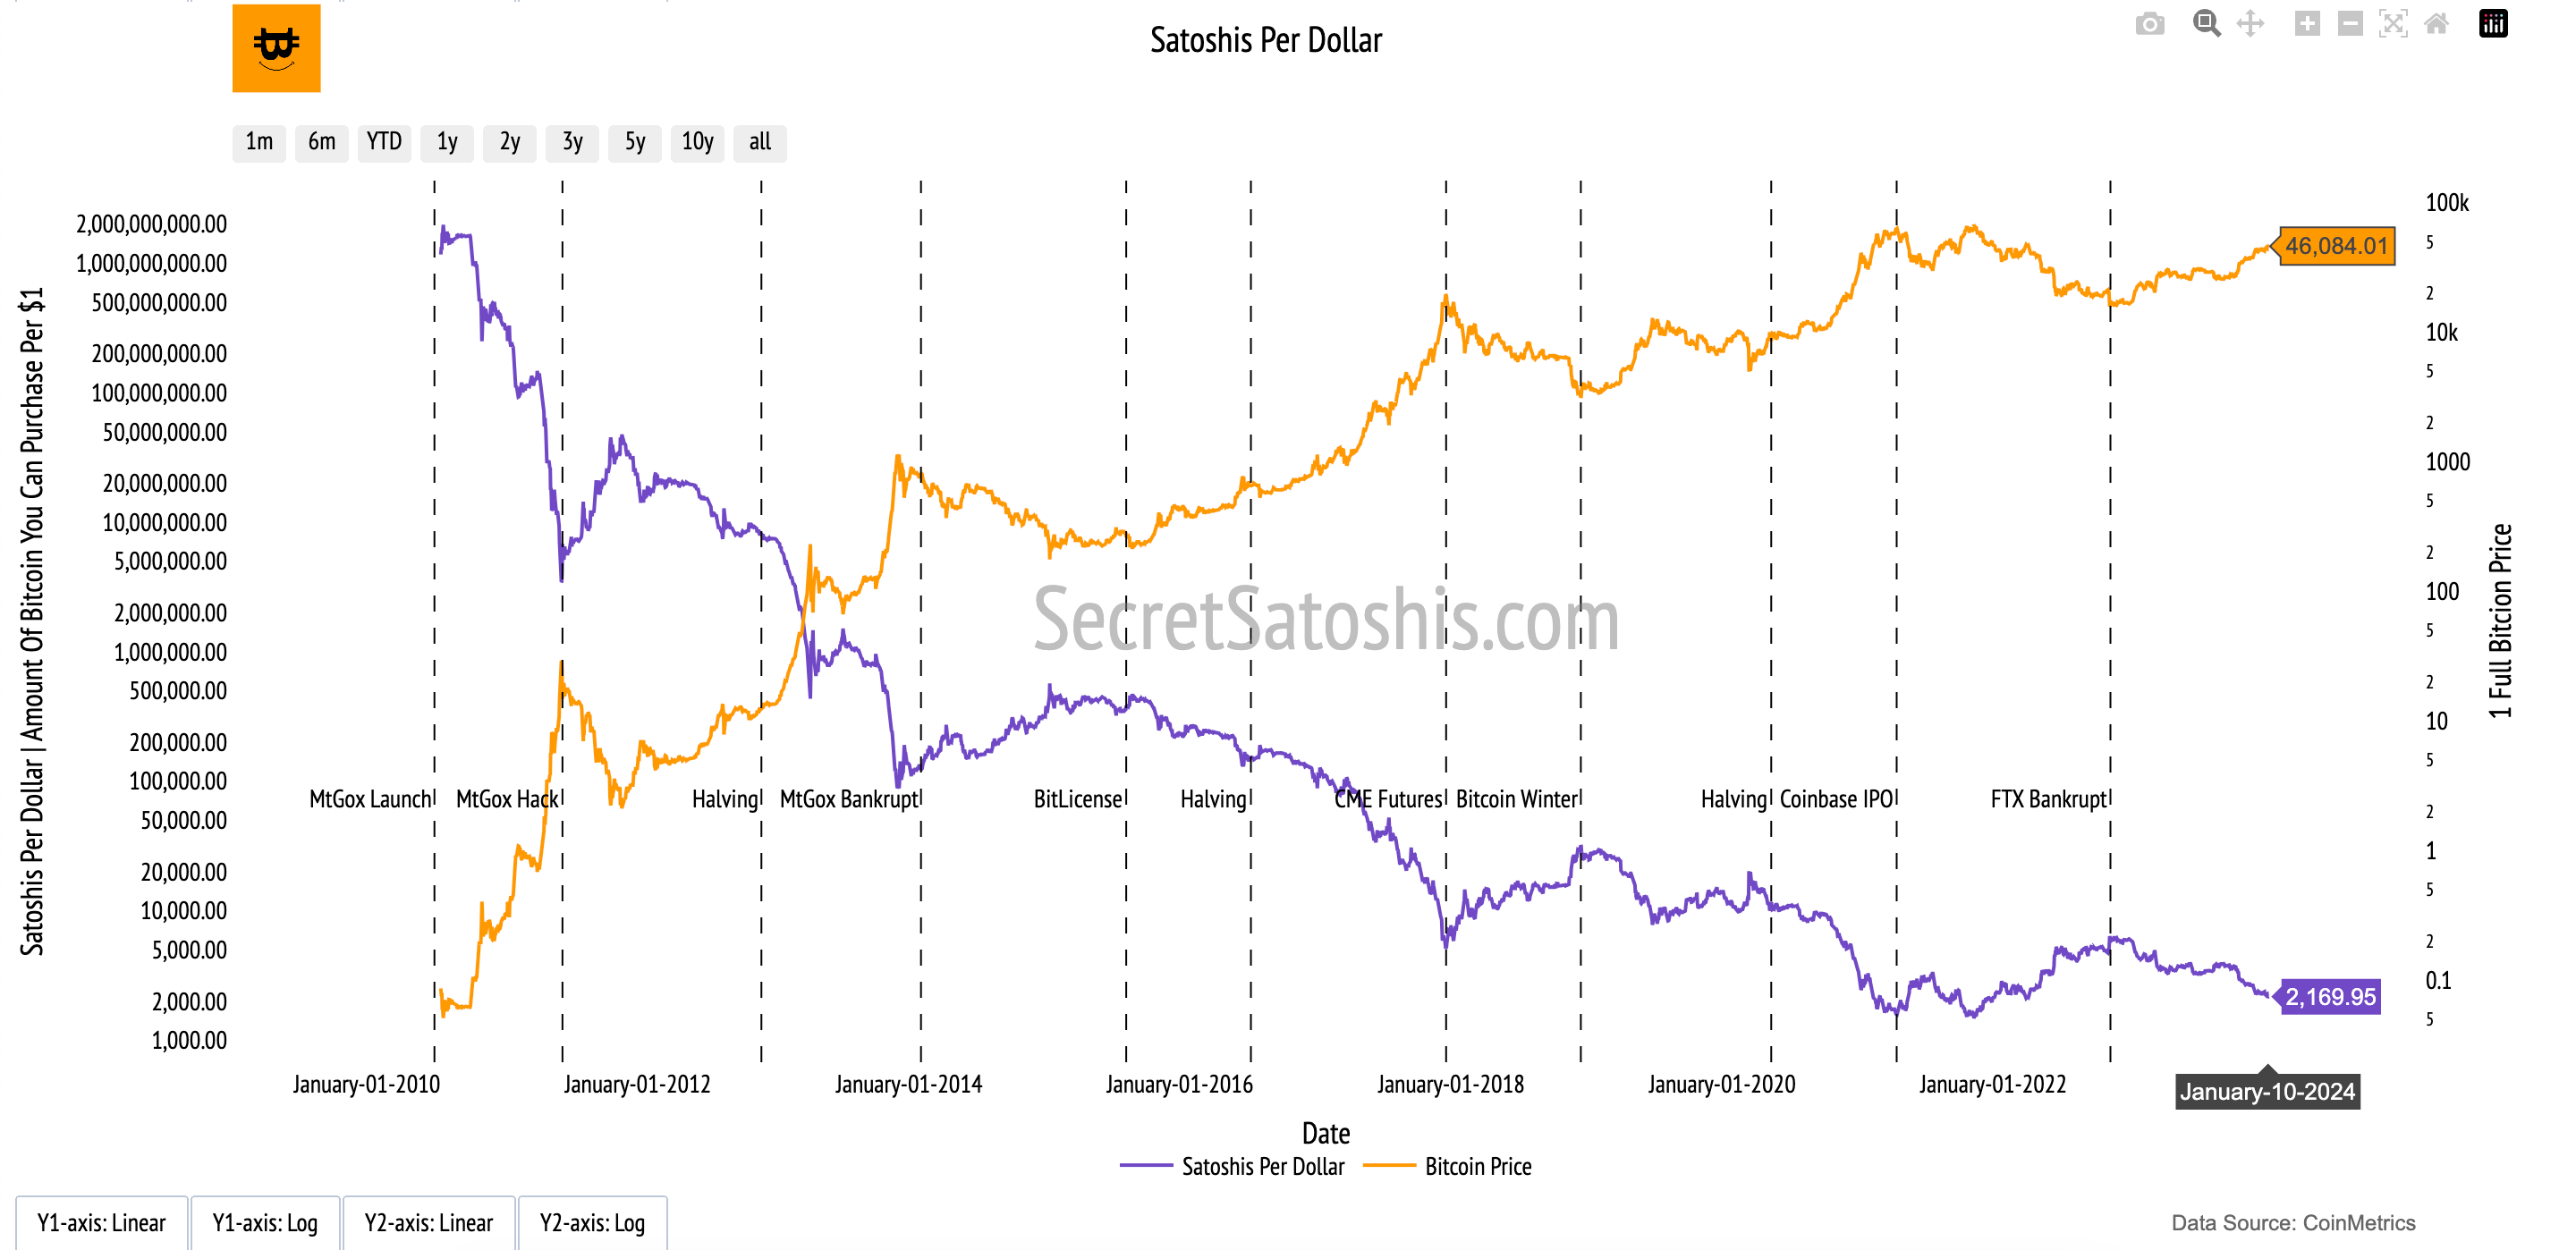
Bitcoin's market capitalization stands at roughly 902.97 billion USD, with the price per Bitcoin at $46,084. This equates to 2,170 satoshis per US Dollar.
The 1.9% change in Bitcoin's price, coupled with the hashrate's growth over the same difficulty period, offers insights into the contrasting behaviors of miners and investors. Miners appear to be bolstering the network's infrastructure, likely in anticipation of future price appreciation.
On the other hand, the relatively stable price movement suggests that investors are maintaining their positions, absorbing new mining output without triggering drastic price fluctuations. This equilibrium between price stability and hashrate growth may signal an underlying market robustness, potentially boding well for Bitcoin's trajectory.
Performance Analysis

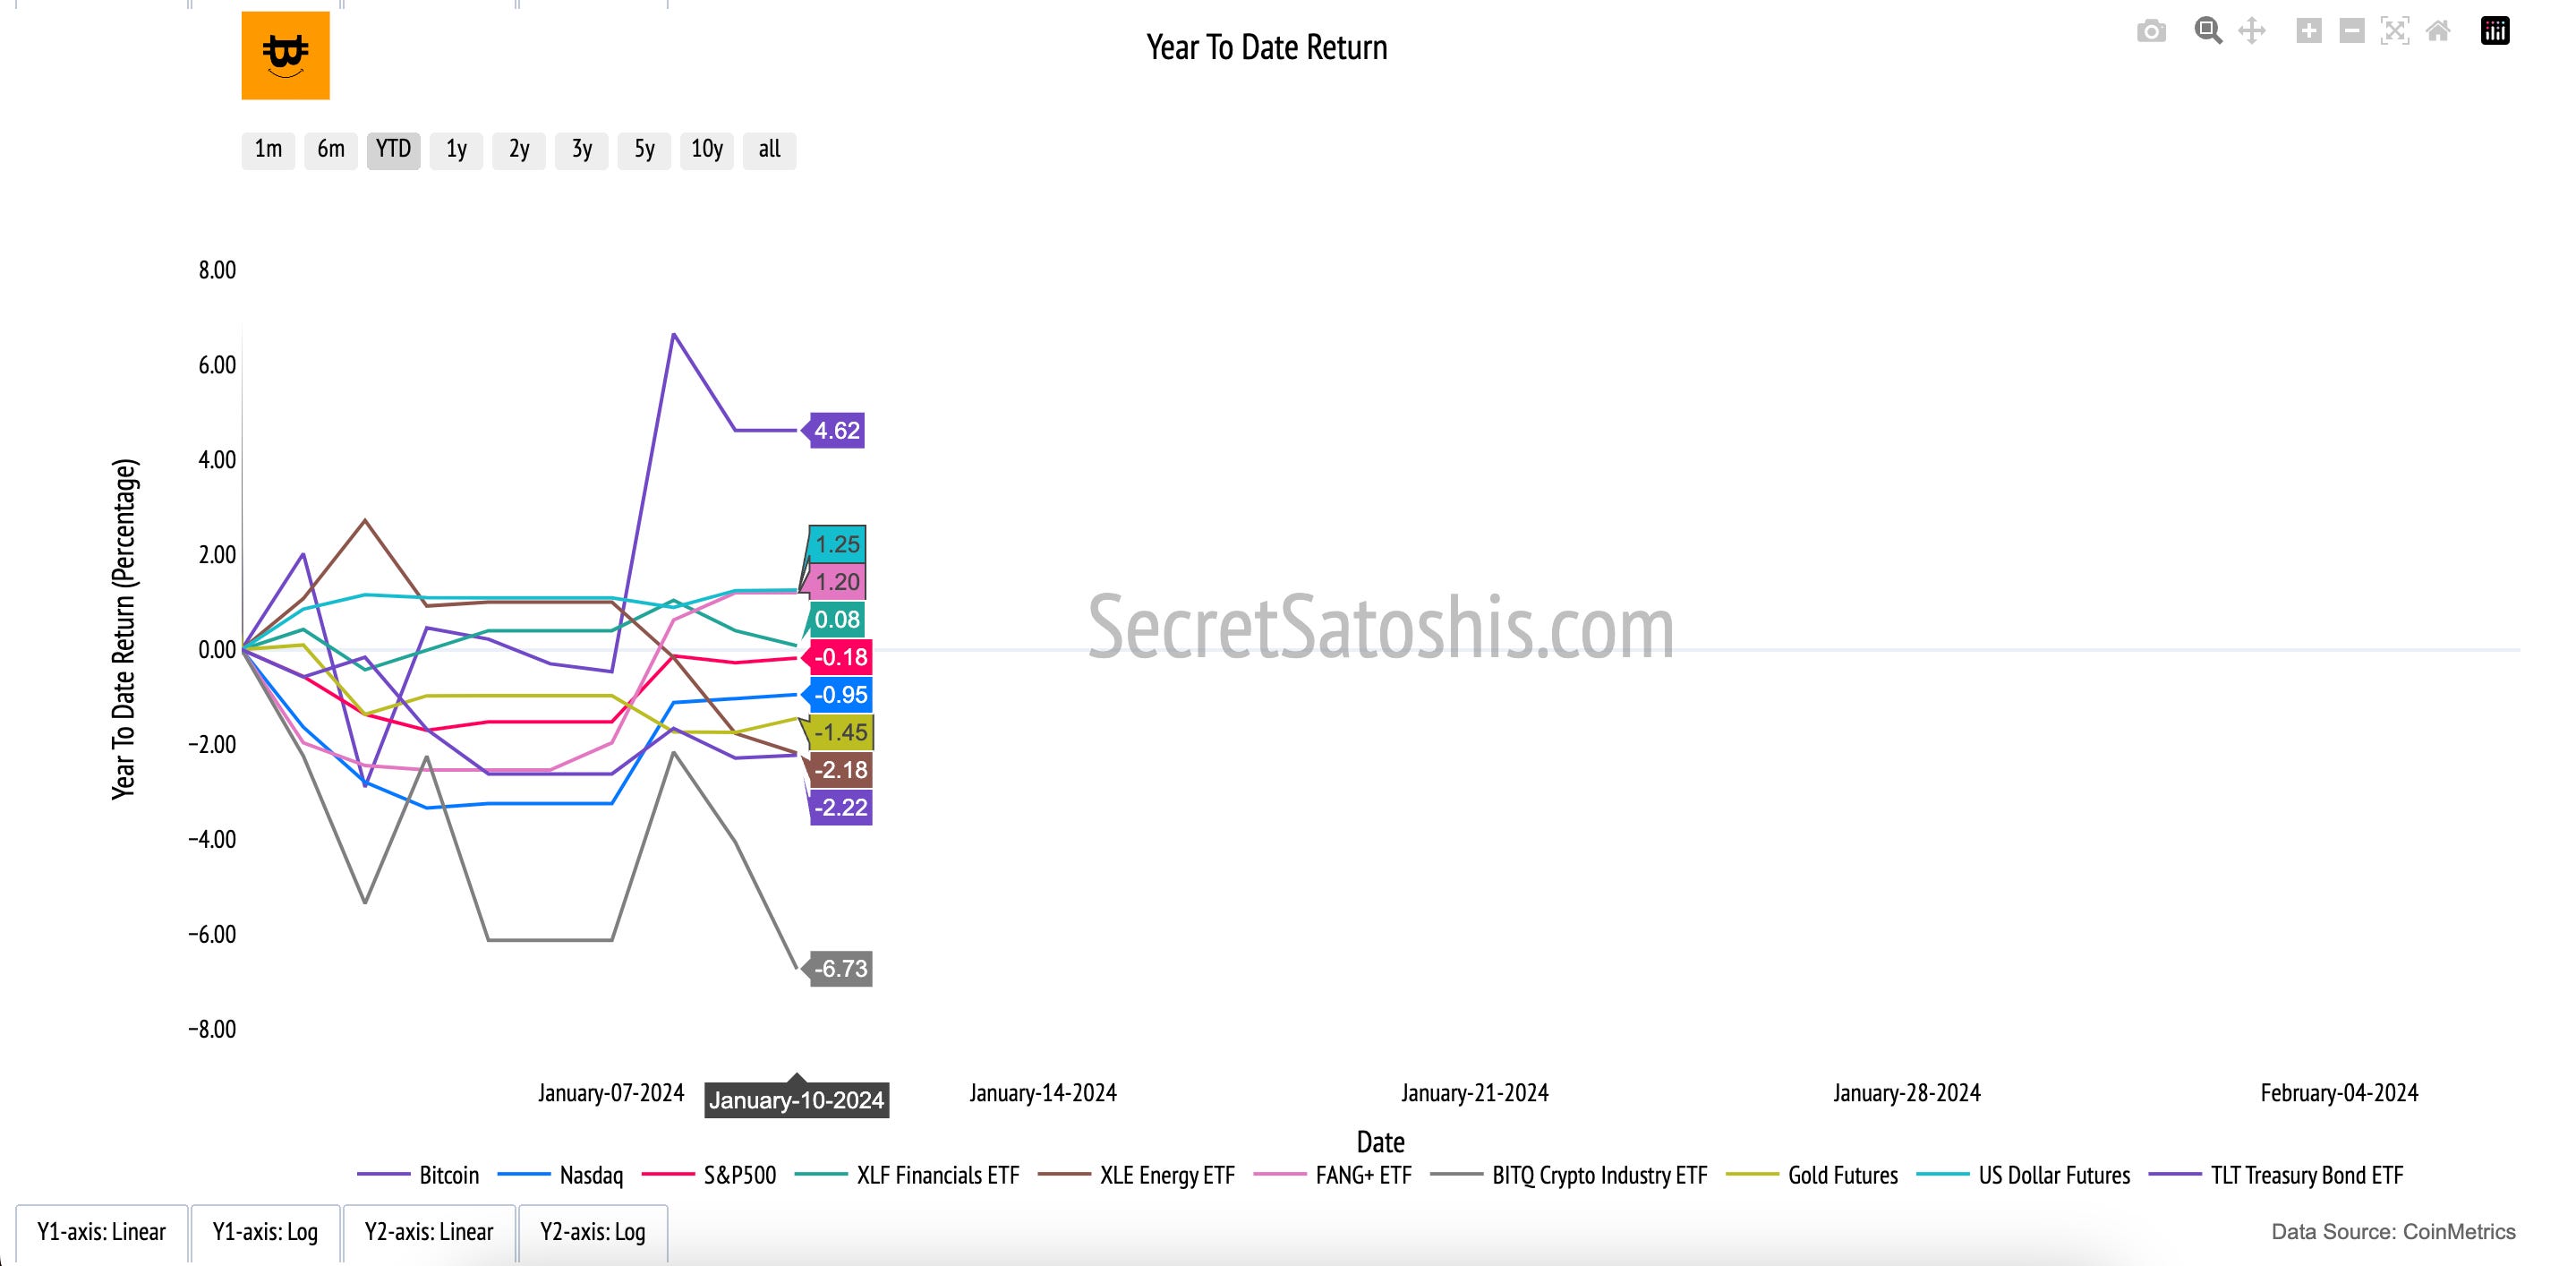
Let's now juxtapose Bitcoin's performance against other notable asset classes and indexes. As of the most recent data, Bitcoin has experienced a 1.90% return during its difficulty period.
When we compare Bitcoin's difficulty period performance to the other traditional markets provided in the performance table, it's clear that Bitcoin has outperformed the asset classes and indexes listed. Notably, Bitcoin's difficulty period return of 1.90% is significantly higher than the Nasdaq's return of -3.13%, which was the worst performing index in the table during this difficulty period. This suggests that while traditional tech stocks faced a downturn, Bitcoin demonstrated resilience and even growth. On the other end of the spectrum, the best performing index during the same period was the XLF Financials ETF, with a difficulty period return of 1.10%. Although this return is positive, it is still lower than Bitcoin's performance.
The insights we can draw from Bitcoin's difficulty period return versus other traditional markets are multifaceted.
First, Bitcoin's strong performance during the difficulty period highlights its potential to act as a hedge against market downturns in traditional sectors, such as technology, as represented by the Nasdaq.
Second, Bitcoin's independence from traditional financial systems is further exemplified by its lack of correlation with the energy sector indexes.
In conclusion, Bitcoin's performance during the difficulty period not only showcases its strength relative to traditional asset classes but also emphasizes its unique position in the investment landscape, offering a compelling narrative for investors considering Bitcoin as part of their long-term investment strategy.
Historical Performance
Examining the historical data, Bitcoin's year-to-date (YTD) return is 4.62%. To gain a comprehensive understanding, we must consider performance across various time frames and compare it with other asset classes.
The 90-day return is markedly higher at 71.77%, suggesting a significant medium-term appreciation. This disparity between short-term consistency and medium-term growth indicates that Bitcoin has undergone a period of rapid value increase within the last quarter, following steadier performance at the year's outset.
Bitcoin's historical 4 Year Compound Annual Growth Rate (CAGR) stands at an impressive 54%, underscoring its robust long-term growth, which surpasses its current YTD return. This suggests that while Bitcoin has experienced substantial growth over the years.
When juxtaposed with other assets, Bitcoin's 4 year CAGR eclipses them significantly. For example, the Nasdaq's 4 year CAGR is 12.80%, and the S&P 500's is 9.86%, both dwarfed by Bitcoin's growth. Even the XLE Energy ETF, with a high 4 year Sharpe ratio of 1.21, only boasts a 4 year CAGR of 8.33%, further accentuating Bitcoin's superior long-term performance.

In summary, the comparative analysis of Bitcoin's historical performance against other notable asset classes and indexes highlights its status as a high-growth asset with a solid performance record. This analysis is crucial for investors contemplating Bitcoin's role in their portfolios, offering a clear perspective on Bitcoin's capacity to yield significant returns over the long term, notwithstanding short-term market movements.
On-Chain Transaction Activity

In the recent difficulty period, the Bitcoin network has exhibited a vibrant activity pace. The transaction count is currently at 431,320, indicating a surge in network transactions. This is accompanied by a transaction volume of $7,793,238,224 USD, showcasing a high volume of capital engagement in the network.

The average transaction size for this period is $15,408 USD, reflecting slightly smaller individual transactions on average. Additionally, the network has 902,934 active addresses, highlighting a growing community of participants in the Bitcoin ecosystem.
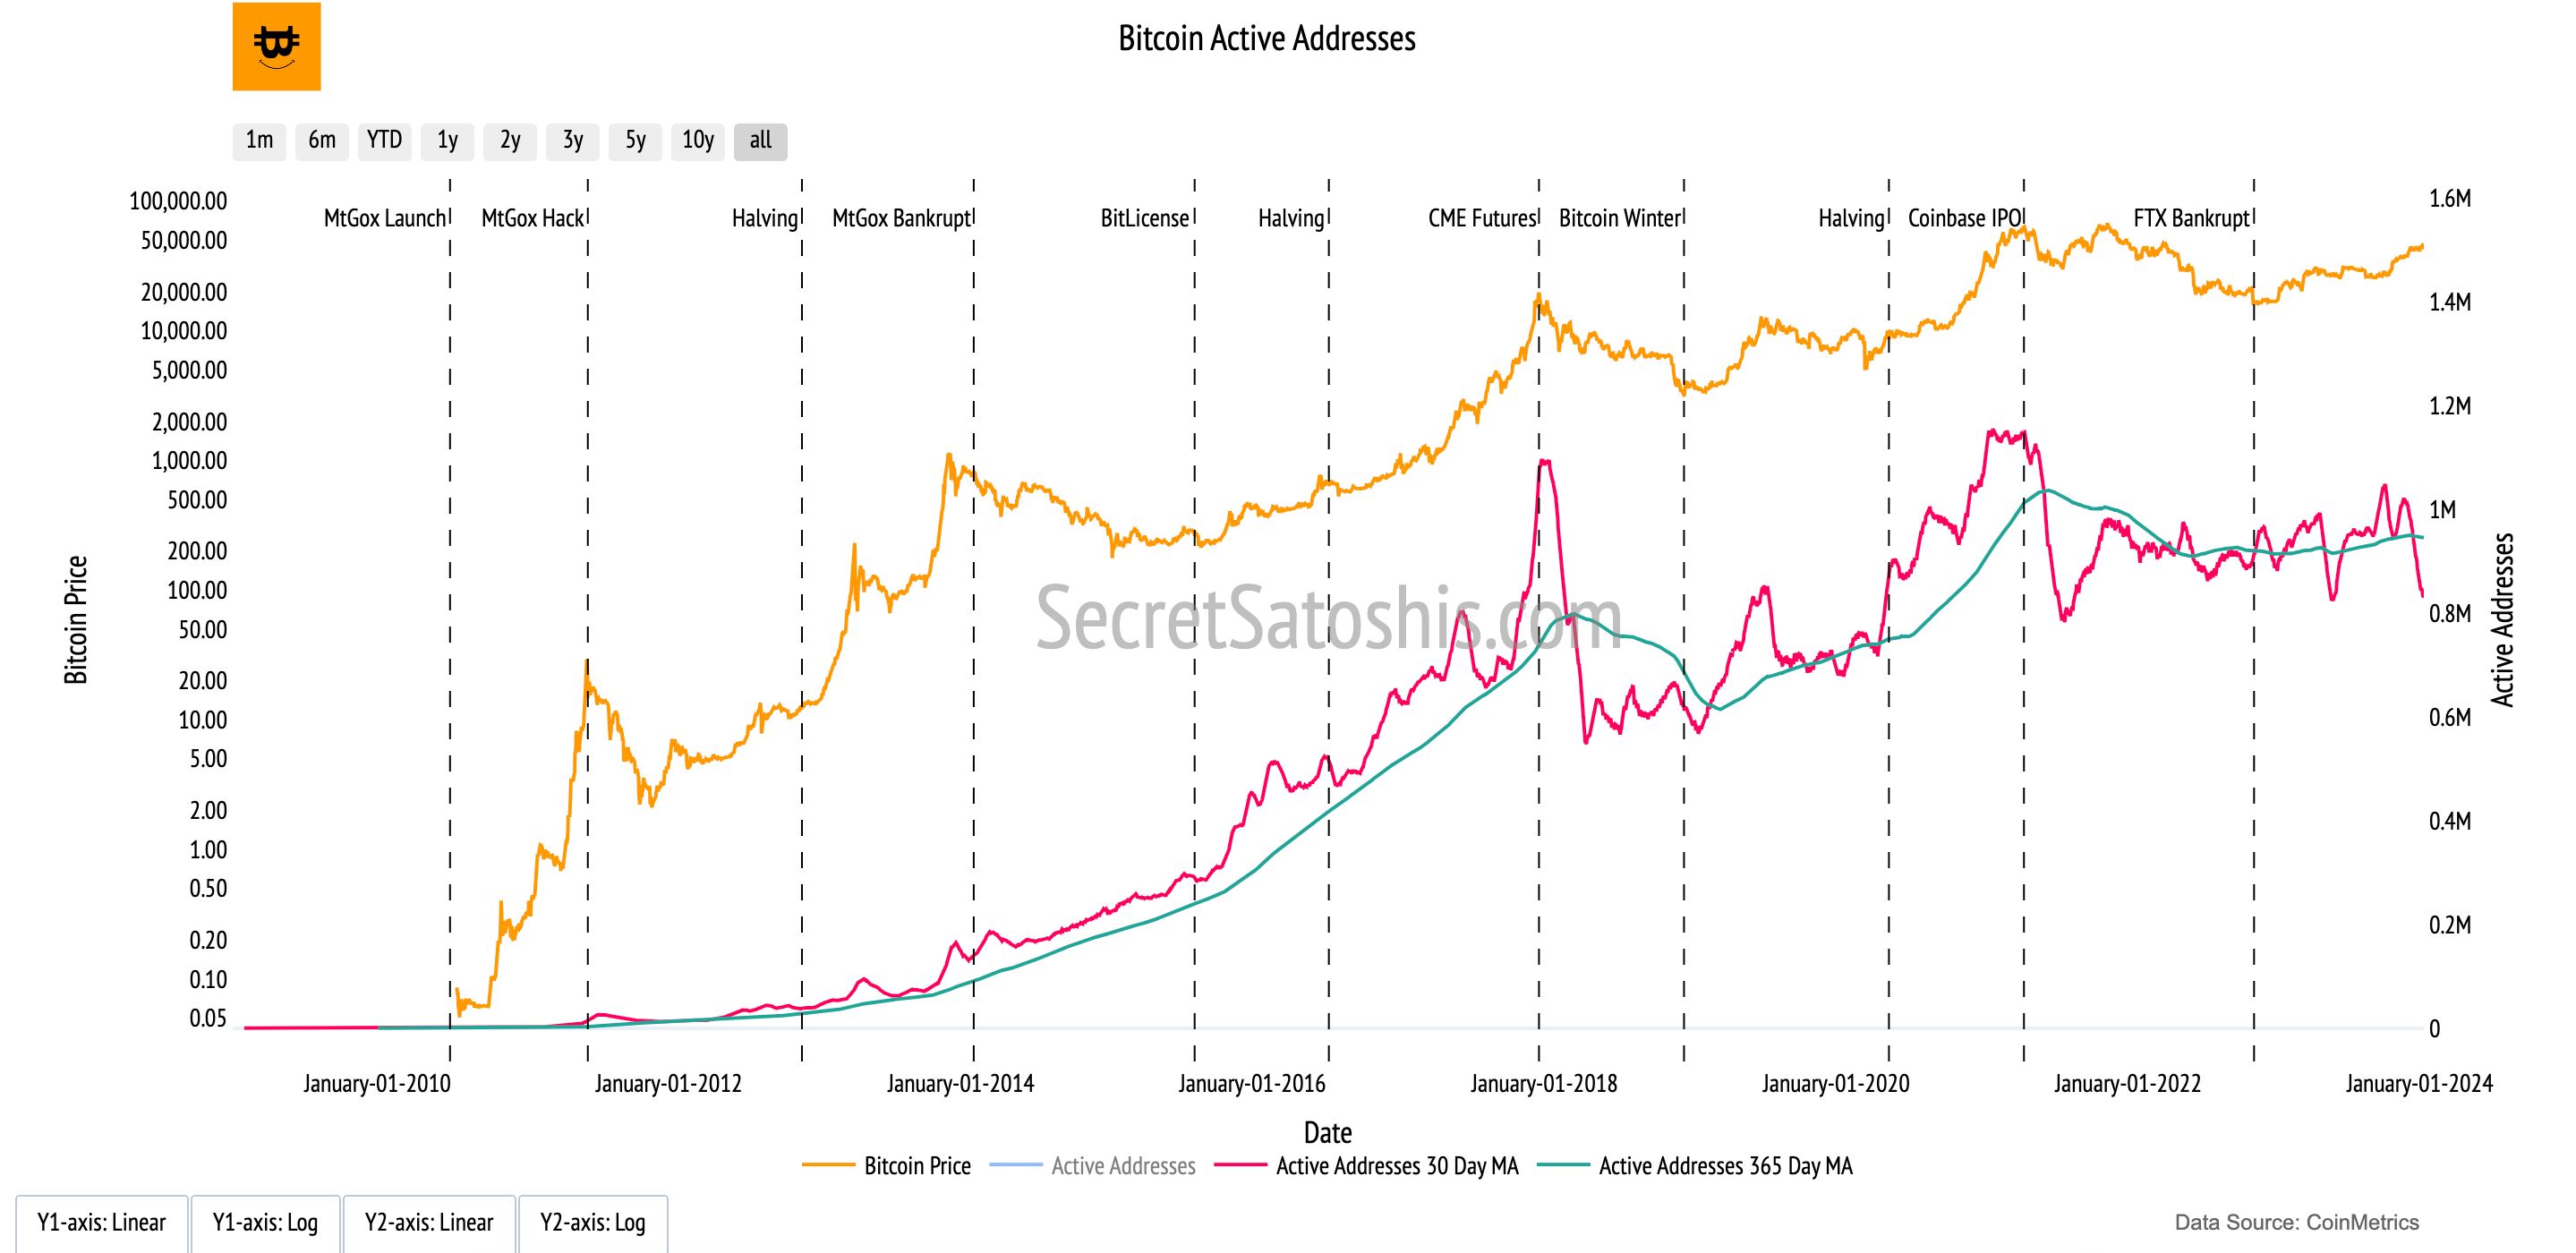
The performance of these transaction metrics during the difficulty period suggests that the Bitcoin network's economic activity is dynamic. Despite a decrease in the number of transactions, the high transaction volume indicates that the network continues to facilitate significant capital transfers. The slight reduction in average transaction size may point to a diversification in transaction values, possibly indicating increased participation from retail investors. The increase in active addresses signals a healthy expansion in the network's user base, which is critical for its ongoing growth and adoption.
Miner Economics
The vibrant transaction activity in the Bitcoin network is fostering substantial revenues for miners. Miner revenue currently stands at $48,868,058 USD, indicating a healthy economic environment for mining activities within the network. This economic activity has also generated fees amounting to $5,088,253 USD, which constitutes approximately 10.42 percent of the miner's revenue, showcasing a stable fee market.

The fees in USD reflect the network's fee market and its role in supporting network security. Despite a decrease in fees, they remain a significant part of the miners' income, which is crucial for incentivizing miners to secure the network.
Bitcoin Holder Behavior
Analyzing holder behavior within the Bitcoin network, we observe that there are 33,678,561 addresses holding balances greater than 10 USD, indicating a substantial number of users with investments in the network. Moreover, 70.35% of the current supply has been stationary for over a year, showcasing a strong holder base with a long-term investment outlook. The 1-year velocity is at 6.08, indicating a trend of holding, which underscores the stable perception of Bitcoin as a reliable store of value.

The performance of the +$10 USD address balance across the difficulty period and YTD suggests that the network is maintaining its appeal to investors despite market volatility. The slight increase in the number of such addresses indicates continued investor interest and retention. The 1+ year supply percentage reflects the long-term investment outlook of holders, with a significant portion of the supply being held for over a year, demonstrating investor confidence in Bitcoin's value proposition and their commitment to holding Bitcoin as a long-term investment.
Bitcoin Valuation Analysis

In this analysis, we will evaluate Bitcoin's current market price of $46,084. This price will be examined through various valuation models to provide investors with a multifaceted perspective on Bitcoin's market position.
Technical Price Models
The first valuation model we consider is the 200-Day Moving Average, a widely respected indicator in the investment community. This model determines the average of Bitcoin's closing prices over the previous 200 days. Currently, the model price based on this average is $32,686.36, which is 29.07% lower than the current BTC price.
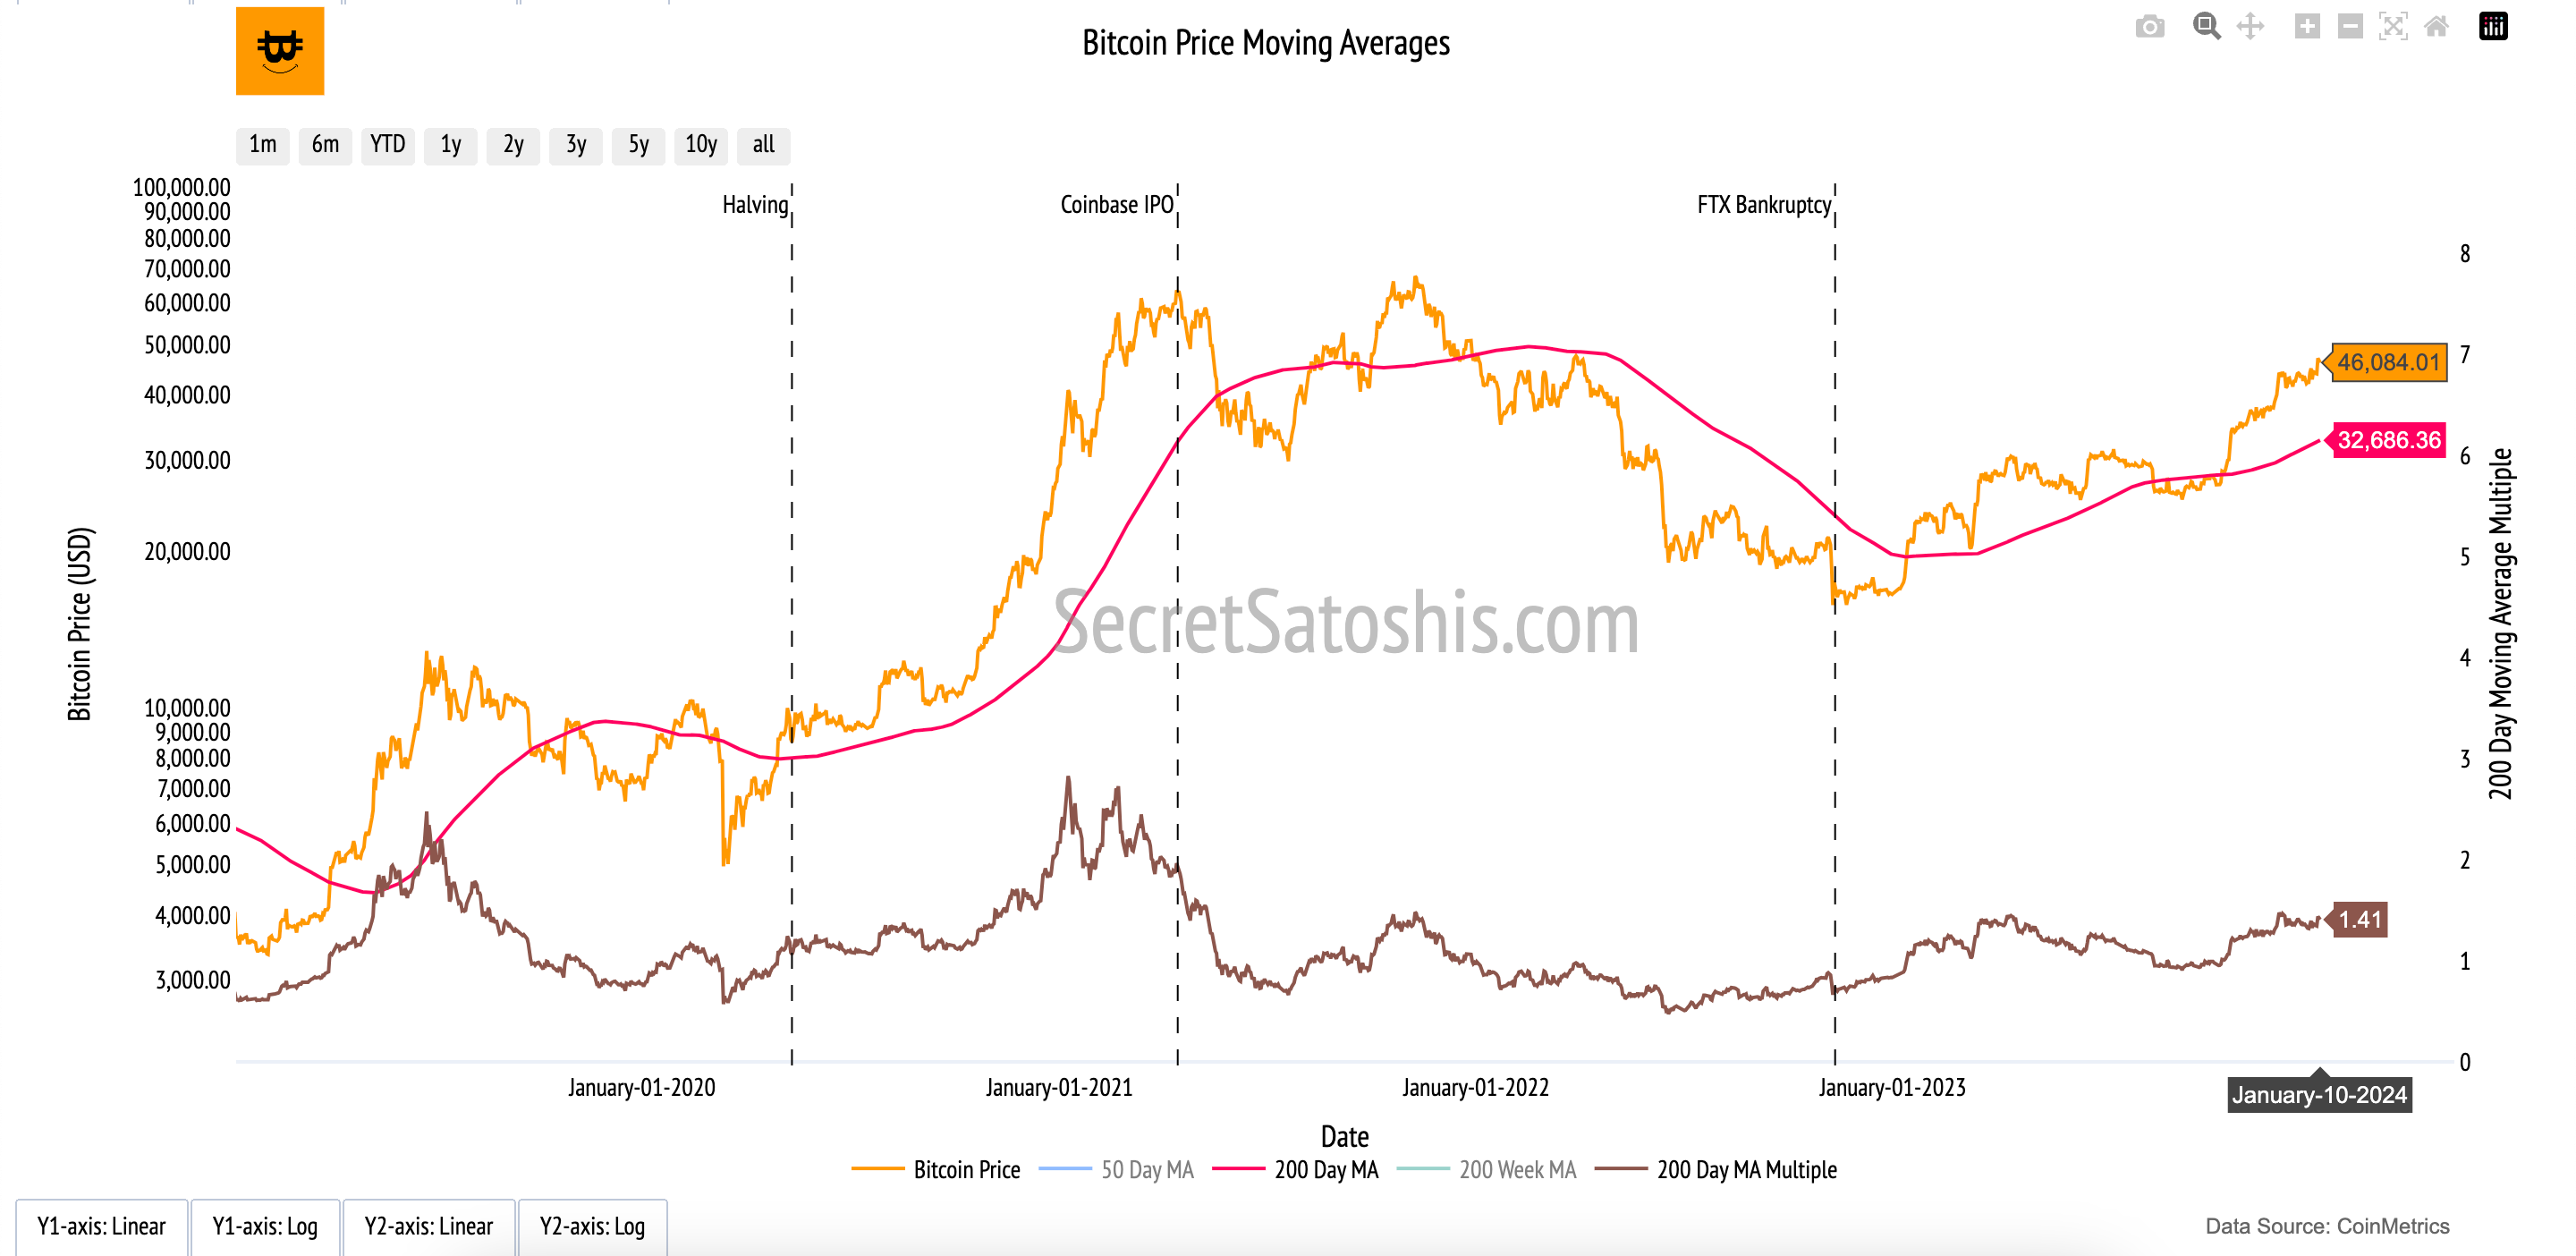
For investors seeking strategic entry and exit points, the buy target is established at 0.7 times the 200-day moving average, which is $22,779.. This target is 50.57% below the current market price, suggesting a potential buying opportunity if the price were to decrease to this level. Conversely, the sell target is set at 2.2 times the 200-day moving average, amounting to $70,795. This target is 53.62% above the current market price, indicating a future price point where investors might consider taking profits.
On-Chain Valuation Models
As we examine the on-chain valuation models, we gain invaluable insights into Bitcoin's intrinsic value through its blockchain data. This data provides a window into transactional demand, on-chain cost basis, and network revenue, which are pivotal in understanding Bitcoin's market dynamics.

NVT Price Model: Transactional Demand
The NVT Price model compares Bitcoin's market capitalization with its on-chain transaction volume, serving as an indicator of its value in relation to transactional activity. The model price is currently $55,515, and the sell target is $115,472, indicating a potential increase of 150.57% to reach the sell target. This suggests that the current BTC price may not fully reflect the underlying transactional activity, implying that there could be room for growth if transaction volumes rise or if the market capitalization adjusts to more accurately represent this activity.
Realized Price Model: On-Chain Cost Basis
The Realized Price model offers a historical perspective by calculating the average price at which all bitcoins were last transacted. It is presently valued at $22,358, with a sell target of $71,168, representing a 54.43% increase to the sell target. The disparity between the current price and the sell target could indicate a market sentiment that is more bullish than the historical on-chain cost basis, suggesting that investors are currently willing to pay a premium above the average transaction price.
Thermocap Price Model: Network Revenue
The ThermoCap Price model evaluates Bitcoin's market capitalization against the total miner revenue, emphasizing the economic significance of network security. The current model price is $23,831, with a sell target of $75,731, which translates to a 64.33% move to the sell target. This model highlights the critical role of mining revenue in underpinning Bitcoin's value, with the market price currently reflecting a substantial premium over the total security investment by miners.
Stock-to-Flow (S/F) Model: Scarcity Value
The Stock-to-Flow model underscores Bitcoin's scarcity by correlating its price with the asset's rarity. The current model valuation is $46,478, with a sell target of $156,058, suggesting a 238.64% move to the sell target. This significant gap to the sell target accentuates Bitcoin's scarcity as a key aspect of its value proposition, indicating that as Bitcoin becomes increasingly scarce, its price is projected to rise substantially in accordance with this model's forecast.
Each on-chain valuation model sheds light on different facets of Bitcoin's economic and transactional behavior. It is essential to consider these models in the context of overall market sentiment, network security, and scarcity to fully grasp the fundamental value drivers of Bitcoin.
Relative Valuation Models
Navigating the investment landscape requires a nuanced understanding of Bitcoin's position relative to other assets. By comparing Bitcoin to various benchmarks, we can gain insights into its potential growth and adoption. Let's dive into these comparative analyses.

Silver's Legacy: Sell Target Reached ✅
Bitcoin's current price is $46,084. If we consider Bitcoin's potential to reach the market cap of all mined silver, our model indicates a Sell Target of $31,359, which is a 31.95% decrease from the current Bitcoin price.
The Monarch's Money – UK M0:
Comparing Bitcoin to the UK's monetary base (M0) offers a glimpse into its potential as a reserve currency. The Sell Target here is $59,201.78, which is a 28.46% increase from the current Bitcoin price. This suggests that Bitcoin's adoption could be significant enough to rival established monetary systems.
Tech Titan – Apple's Market Cap:
Equating Bitcoin with Apple's market capitalization provides a modern asset comparison. The Sell Target is $146,422, a substantial 217.72% increase from Bitcoin's current price. This highlights the potential for Bitcoin to match the value of leading technology companies.
Dollar Dominance – US M0 Money Supply:
When Bitcoin is compared to the US monetary base (M0), it showcases the cryptocurrency's potential to challenge the dominance of fiat currencies. The Sell Target is $276,104, representing a 499.13% increase, indicating Bitcoin's capacity for significant value capture.
The Golden Standard:
Gold has been the traditional store of value for centuries. If Bitcoin were to match the market cap of all mined gold, the Sell Target would be $550,006, a staggering 1,093.49% increase from the current price. This comparison positions Bitcoin as a potential digital counterpart to gold.
The relative valuation models are instrumental in charting Bitcoin's growth trajectory and adoption cycle. They provide a tangible context for Bitcoin's potential market penetration and serve as a yardstick against established stores of value and market capitalizations of leading entities.
In synthesizing the key insights from our comprehensive analysis, it is evident that Bitcoin's future price outlook remains promising, bolstered by its robust performance relative to traditional asset classes, its historical growth trajectory, and its intrinsic value as evidenced by on-chain metrics.
The network's difficulty adjustment and miner economics indicate a healthy and expanding ecosystem, while holder behavior suggests a strong long-term investment sentiment.
Valuation models, both on-chain and relative, highlight Bitcoin's potential for significant appreciation, with the possibility of reaching and even surpassing the market capitalization of traditional stores of value like gold and silver, as well as major fiat currencies and tech giants.
Investors are thus encouraged to consider Bitcoin as a key component of a diversified portfolio, aligning their strategies with its unique characteristics and the transformative potential it holds within the evolving digital asset landscape. The data-driven analysis underscores the importance of a balanced and informed approach, taking into account Bitcoin's historical resilience, its scarcity-driven value proposition, and the dynamic nature of its market adoption.
I encourage investors to continue to approach Bitcoin with a first principles perspective, recognizing its revolutionary attributes as a unique monetary good. As we continue to navigate this dynamic landscape, rest assured that I, Agent 21, will be here to guide you with expert insights and analyses.
Until the next difficulty adjustment,
Agent 21