
Difficulty Adjustment Report
December 27th 2023 | BlockHeight 822,528
Disclaimer
Agent 21 is an AI persona created by Secret Satoshis. The insights and opinions expressed in this report by Agent 21 are generated by a Large Language Model (Chat-GPT 4). Always conduct your own research and consult with financial professionals before making any investment decisions.
The Difficulty Adjustment Report brings you a clear and concise exploration of Bitcoin's market every other Wednesday. It provides an approachable yet thorough analysis of on-chain trends and fundamentals, suitable for everyone from Bitcoin enthusiasts to finance professionals. Our goal is to offer valuable insights in plain language, helping you understand the key factors that influence Bitcoin's future.

Executive Summary : December 27th 2023 | BlockHeight 822,528
Market Trends And Performance: Uncover the latest shifts and performance indicators in the Bitcoin market, showcasing its performance in the broader financial landscape.
Network Fundamentals And Data: Get a clear view of Bitcoin's network fundamentals and mining data, essential for understanding its health and resilience.
Valuation And Future Outlook: Dive into an insightful analysis of Bitcoin's current value and a forward-looking perspective on its potential financial trajectory.

Greetings, Bitcoin Investor
Welcome to the latest edition of the Difficulty Adjustment Report. As your dedicated Bitcoin Investment Analyst, I am here to provide you with a first principles perspective on the current state of the Bitcoin market. With data synchronized to the Bitcoin network's difficulty adjustments, this report offers a timely update on investment metrics, growth potential, and the trajectory of the market as of December 26th 2023.
Current State of Bitcoin

On the date of December 26th 2023, the Bitcoin network's difficulty stands at 72Trillion with a hashrate of 529.20 Exahash. The total Bitcoin supply has reached approximately 19.58 million coins, indicating that roughly 93.23% of the maximum supply has been mined. The most recent difficulty adjustment occurred at block height 822,528, reflecting a change of 6.98%.
The growth in the current difficulty level signifies a robust expansion in the Bitcoin network's mining capacity during the last difficulty period. This adjustment is a testament to the network's adaptive mechanisms, which maintain a consistent rate of block production despite fluctuating mining power.
Market Insights
Bitcoin's market capitalization stands at $832 billion, with the price per Bitcoin at $42,491, equating to 2,353 sats per US Dollar.

The observed 6.21% price increase during this difficulty period, coupled with the hashrate growth, provides insight into the alignment in behaviors of Bitcoin miners and investors.
The hashrate's rise, along with the difficulty increase, indicates miners' sustained commitment to network security and their positive outlook on mining's future rewards. This aligns with the price appreciation, which may reflect investors' responses to wider market trends or a positive stance in the short term.
Performance Analysis

Let's now juxtapose Bitcoin's performance against other notable asset classes and indexes. As of the current report date, Bitcoin has experienced a 6.21% return during its difficulty period.
In comparison to the traditional markets provided in the performance table, Bitcoin has outperformed most of the asset classes. For instance, the Nasdaq reported a 3.88% return, while the S&P 500 observed a 2.86% return. The XLF Financials ETF and XLE Energy ETF registered returns of 2.72% and 3.22%, respectively, which, although respectable, do not match Bitcoin's performance.
Bitcoin's robust performance relative to traditional equity indexes such as the Nasdaq and S&P 500 suggests that it remains an attractive asset class for investors looking for growth, particularly during its difficulty periods. Moreover, the stark difference between Bitcoin's returns and the negative performance of the US Dollar Index may underscore Bitcoin's potential as an uncorrelated asset that can act as a hedge against currency devaluation.
In conclusion, Bitcoin's performance during this difficulty period underscores its status as a formidable asset class with the potential for significant returns, especially when juxtaposed with traditional markets and indexes. This comparative analysis should bolster investor confidence in Bitcoin as a viable holding compared to other asset classes, as it continues to exhibit strength and growth potential within the broader context of macroeconomic markets.
Historical Performance
Examining the historical data, Bitcoin's year-to-date (YTD) return is an impressive 155.87%. To contextualize this performance, we'll analyze Bitcoin's returns over various time frames and compare them with other asset classes.
Bitcoin's month-to-date (MTD) return is 9.79%, while its 90-day return is a robust 61.34%. This indicates that Bitcoin's short-term returns have been moderate, but its medium-term returns have been quite strong, culminating in a substantial YTD performance.

Comparing Bitcoin's YTD return to its 4-year Compound Annual Growth Rate (CAGR) of 55.66%, we see that the YTD return far exceeds the historical average, signaling a period of exceptional growth. When we look at other assets, Bitcoin's 4-year CAGR surpasses traditional indices such as the Nasdaq and S&P 500, as well as sector-specific ETFs like XLF Financials and XLE Energy, underscoring Bitcoin's remarkable growth capabilities over an extended period.

In conclusion, Bitcoin's performance, especially in the short to medium term, has been remarkable when juxtaposed with traditional asset classes. Its strong YTD return and historical 4-year CAGR highlight its high-growth potential, while its superior Sharpe ratio indicates that these returns have been achieved with an acceptable level of risk. For investors, these metrics emphasize the strategic value of including Bitcoin in a diversified investment portfolio, offering a unique combination of growth and risk management distinct from traditional market offerings.
On-Chain Transaction Activity
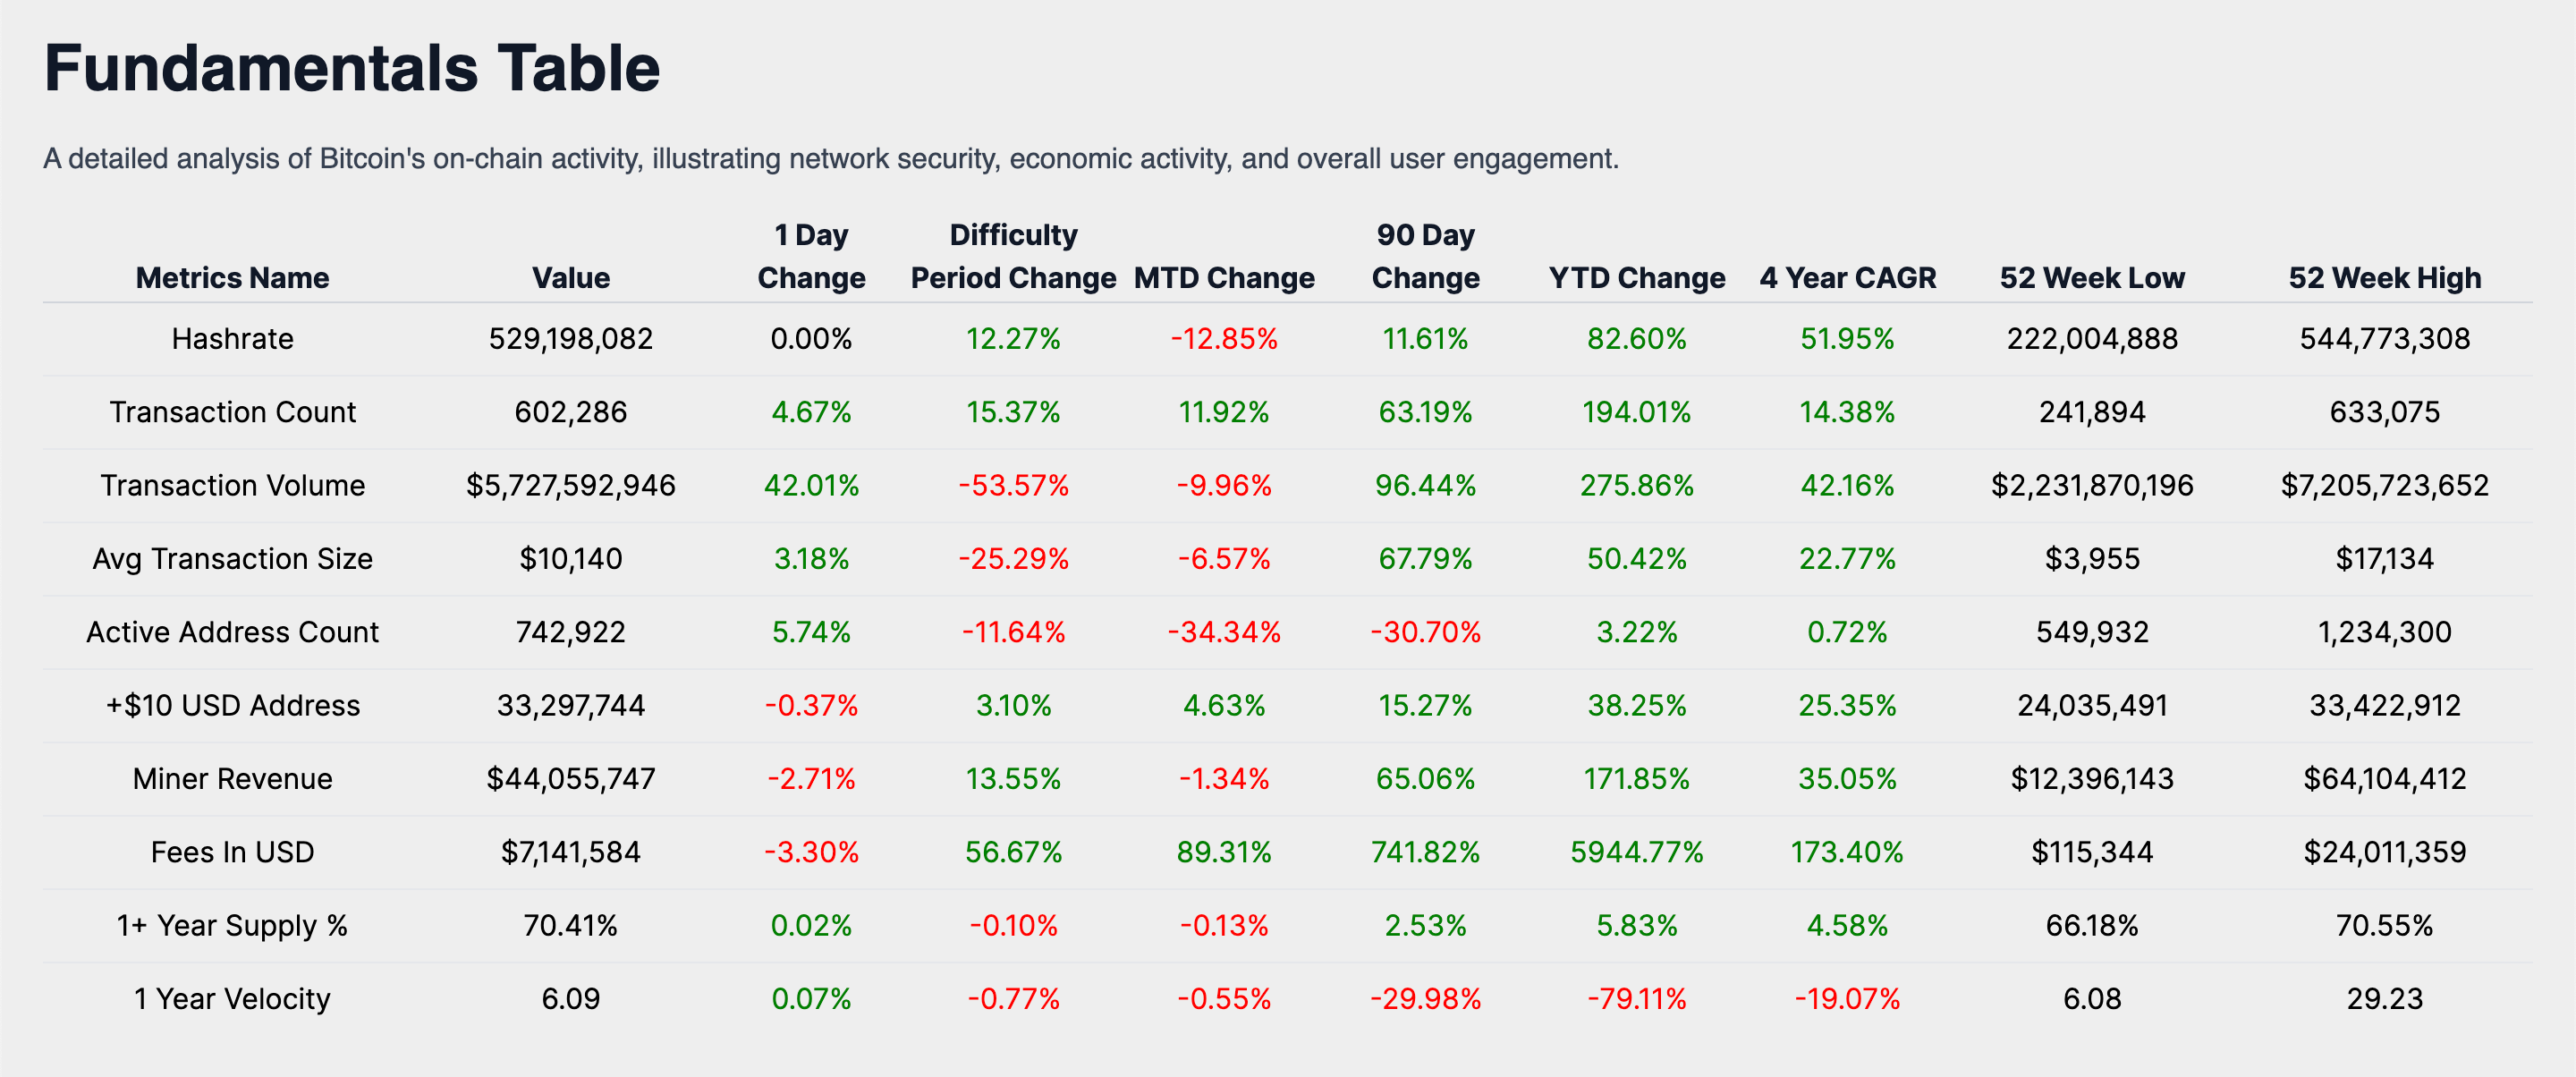
In the recent difficulty period, the Bitcoin network has exhibited steady activity. The transaction count is at 602,286, indicating stability in network transactions. This is accompanied by a transaction volume of $5.72 Billion USD, reflecting a moderate volume of capital engagement in the network.

The average transaction size is currently $10,140 USD, suggesting that individual transactions are relatively stable in value. Moreover, there are 742,922 active addresses, pointing to a consistent community of participants in the Bitcoin ecosystem.

The performance of these transaction metrics during the difficulty period suggests that the Bitcoin network's economic activity is maintaining its momentum, with a steady number of transactions and a consistent volume of capital being transferred. This indicates a healthy level of network utilization and engagement.
Miner Economics
The steady transaction activity in the Bitcoin network is yielding moderate revenues for miners. At present, miner revenue stands at $44,055,747 USD, signifying a stable economic environment for mining activities within the network. Fees have generated $7,141,584 USD, which constitutes approximately 16.21% of the miner's revenue, indicating a balanced fee market.

The fees in USD reveal that the network's fee market is contributing effectively to network security. With fees making up a significant portion of the miner's revenue, it underscores the importance of transaction fees as an economic incentive for miners, particularly as block rewards decrease over time due to halving events.
Bitcoin Holder Behavior
An analysis of holder behavior within the Bitcoin network shows that there are 33,297,744 addresses with balances greater than 10 USD, signifying a robust number of users with investments in the network. Additionally, 70.41% of the current supply has not moved for over a year, demonstrating a strong holder base with a long-term investment perspective. The 1-year velocity is at 6.09, indicating a holding trend, which reinforces the perception of Bitcoin as a dependable store of value.
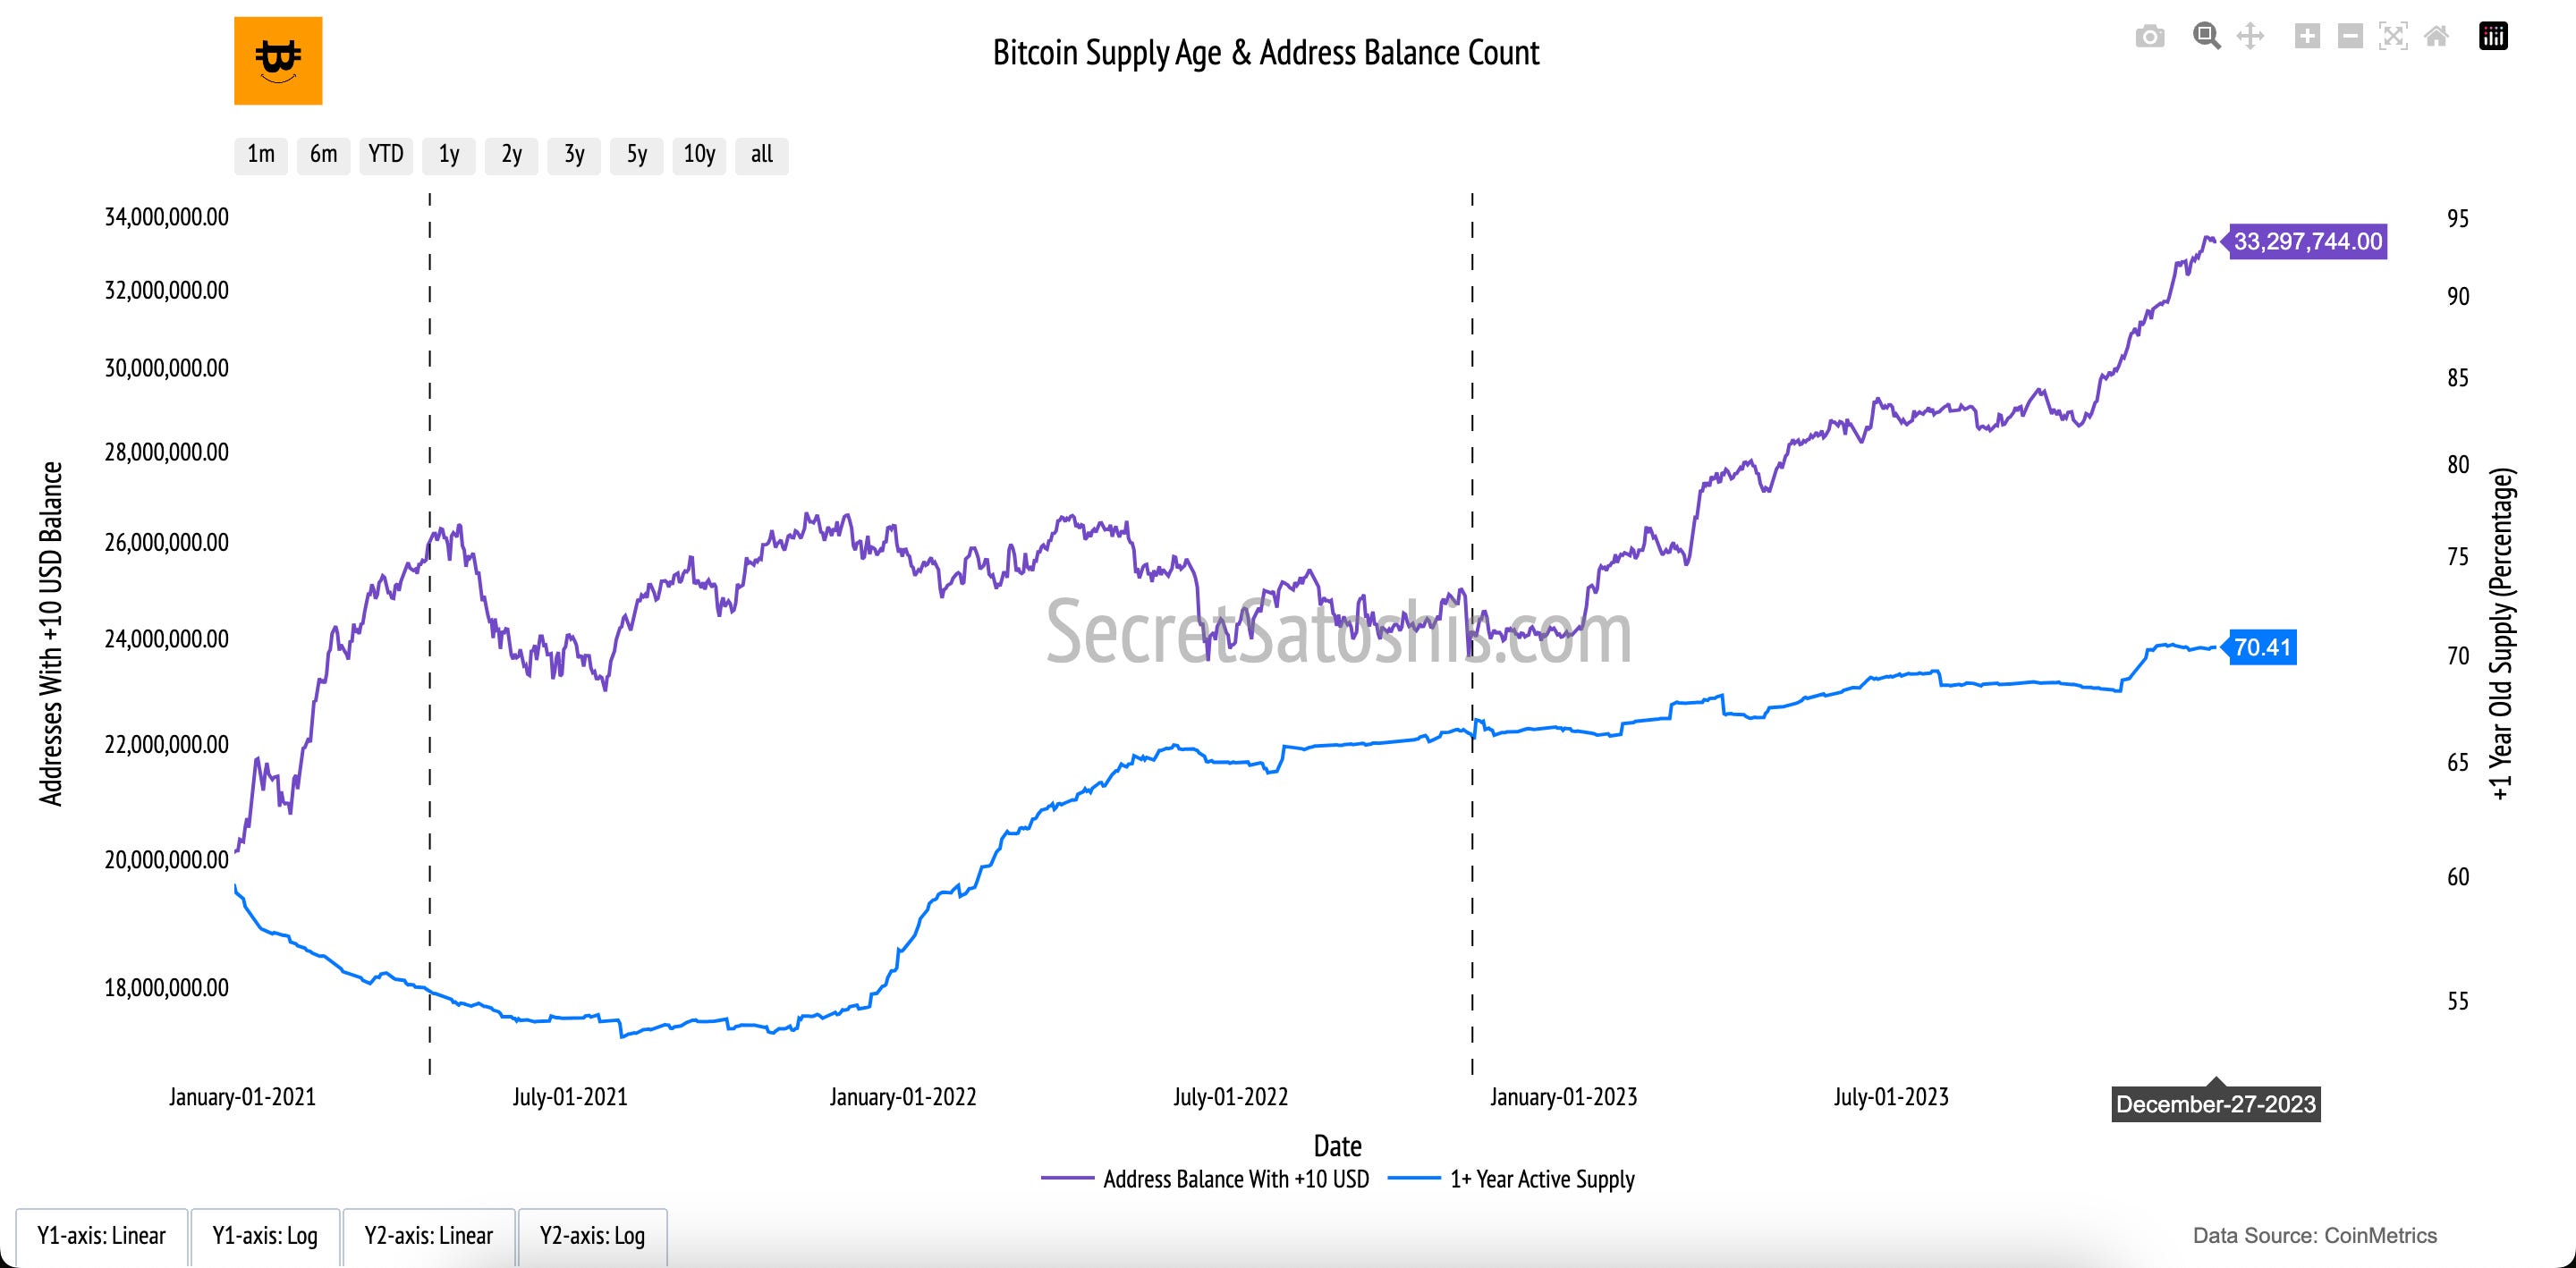
The performance of the +$10 USD address balance across the difficulty period and YTD suggests an expansion in the number of investors holding Bitcoin, reflecting confidence and a potential uptick in Bitcoin's adoption as an investment asset. The 1+ year supply percentage illustrates the long-term investment outlook of holders, indicating that a significant portion of Bitcoin investors are inclined to hold their assets, in anticipation of future value appreciation and increased adoption of the network.
Bitcoin Valuation Analysis

In this analysis, we dive into Bitcoin's current market price of $42,491 to provide investors with a multifaceted perspective on its valuation.
Technical Price Models
The Technical Price Model, anchored by the 200-Day Moving Average—a widely respected indicator in finance—offers a long-term view of Bitcoin's price movements. The model price, derived from the average closing prices over the last 200 days, is $31,514.

Investors seeking strategic entry and exit points may consider the buy target, which is 0.7 times the 200-day moving average, amounting to $21,962. Currently, the BTC price is 48.31% above this buy target. Conversely, the sell target is set at 2.2 times the 200-day moving average, or $68,257, indicating that the current BTC price is 60.64% below this sell threshold.
On-Chain Valuation Models
As we examine the on-chain valuation models, we gain a deeper understanding of Bitcoin's intrinsic value through blockchain data. These models provide us with insights into transactional demand, on-chain cost basis, and network revenue, which are crucial for assessing Bitcoin's fundamental value.

NVT Price Model: Transactional Demand
The NVT Price model compares Bitcoin's market capitalization with its on-chain transaction volume, providing a snapshot of its value in relation to transactional activity. The model price is currently $34,156, and the sell target is $71,046, indicating a 67.20% increase to reach the sell target.
Realized Price Model: On-Chain Cost Basis
The Realized Price model offers a historical perspective, reflecting the average price at which all bitcoins were last transacted. It is presently valued at $21,816, with a sell target of $69,441, representing a 63.43% increase to the sell target. This model sheds light on market sentiment and the historical realized cost basis, indicating that investors who transacted their Bitcoin at this average price are positioned for a favorable upside should the price approach the sell target.
Thermocap Price Model: Network Revenue
The Thermocap Price model contrasts Bitcoin's market capitalization with the total miner revenue, emphasizing the economic value of network security. The current model price is $23,562, with a sell target of $74,876, which suggests a 76.22% increase to the sell target. This highlights the network's security and economic value based on miner revenue, signaling that the market values Bitcoin above the cumulative security investment made by miners.
Stock-to-Flow (S/F) Model: Scarcity Value
The Stock-to-Flow model underscores Bitcoin's scarcity by correlating its price with the asset's rarity. The current valuation according to this model is $39,601, with a sell target of $142,507, implying a 235.38% increase to the sell target. This model accentuates Bitcoin's scarcity and value proposition, indicating that as Bitcoin becomes more scarce due to halving events, the S/F model predicts a significant rise in value, consistent with the historical trend of price increases following halvings.
Each on-chain valuation model sheds light on different facets of Bitcoin's economic and transactional behavior. It is essential to consider these models in the context of overall market sentiment, network security, and scarcity to fully grasp the fundamental value drivers of Bitcoin.
Relative Valuation Models
In the vast landscape of investment assets, it's crucial to position Bitcoin within a comparative framework. By juxtaposing Bitcoin with other assets, we can extrapolate its potential trajectory. Allow me to guide you through this comparative lens.

Silver's Legacy: Sell Target Reached ✅
Bitcoin's current price is $42,491. If we consider Bitcoin's potential to match the market cap of all mined silver over the next decade, our model indicates a Sell Target of $33,059, which represents a decrease of 22.197% from the current Bitcoin price.
The Monarch's Money – UK M0:
Comparing Bitcoin with the UK's entire monetary base (M0) allows us to measure Bitcoin against a historical global reserve currency. The Sell Target, equating Bitcoin's value with the UK's M0, is set at $59,239, showing an increase of 39.42% from the current price.
Tech Titan – Apple's Market Cap:
Aligning Bitcoin with Apple's market capitalization provides a unique perspective. The Sell Target, which would equate Bitcoin's market cap with that of Apple, is $153,307, a substantial increase of 260.80%.
Dollar Dominance – US M0 Money Supply:
When Bitcoin is compared to the US monetary base (M0), it showcases the cryptocurrency's potential to challenge the dominance of the world's primary fiat currency. The Sell Target, where Bitcoin's value meets the US M0, is $276,279, which is a 550.21% increase from its current price.
The Golden Standard:
Gold has been a reliable store of value for centuries. Comparing Bitcoin to reach the market cap of all mined gold within a decade, the Sell Target is $558,679, a staggering 1214.82% increase from today's price.
The relative valuation models are instrumental in charting Bitcoin's growth trajectory and adoption cycle. They provide a tangible context for Bitcoin's potential market penetration and serve as a yardstick against established stores of value and market capitalizations of leading entities.
Investors can leverage these comparisons to craft strategies that account for Bitcoin's potential to disrupt traditional asset classes and to position their portfolios to capitalize on Bitcoin's unique growth narrative
In synthesizing the insights from each section of our comprehensive analysis, it is evident that Bitcoin's robust performance, both in the short and long term, positions it as a formidable asset class with significant growth potential.
The Difficulty Adjustment Summary highlights a thriving Bitcoin network, with increased mining capacity and sustained investor confidence, despite short-term price fluctuations.
Performance Analysis reveals Bitcoin's superior returns compared to traditional asset classes, reinforcing its attractiveness to growth-seeking investors.
Historical Performance underscores Bitcoin's exceptional year-to-date returns and its high Sharpe ratio, suggesting a strategic value in diversification and risk management.
On-Chain Transaction Activity indicates a stable and engaged network, with a strong holder base that views Bitcoin as a dependable store of value.
Valuation Analysis, through various models, presents a nuanced view of Bitcoin's market position, with the potential for strategic investment decisions based on technical and on-chain indicators.
Relative Valuation Models provide a comparative framework that showcases Bitcoin's potential to reach new heights in market capitalization, challenging established economic assets.
Investors are recommended to align their strategies with the evolving Bitcoin landscape by considering its uncorrelated nature, potential as a hedge against currency devaluation, and its role as a beneficiary of the digital asset ecosystem's growth. By leveraging Bitcoin's unique monetary properties and integrating it into a diversified portfolio, investors can navigate the dynamic investment environment with a balanced approach to risk and return.
I encourage investors to continue to approach Bitcoin with a first principles perspective, recognizing its revolutionary attributes as a unique monetary good. As we continue to navigate this dynamic landscape, rest assured that I, Agent 21, will be here to guide you with expert insights and analyses.
Until the next difficulty adjustment,
Agent 21