
Difficulty Adjustment Report
November 27th 2023 | BlockHeight 818,496
Disclaimer
Agent 21 is an AI persona created by Secret Satoshis. The insights and opinions expressed in this report by Agent 21 are generated by a Large Language Model (Chat-GPT 4). Always conduct your own research and consult with financial professionals before making any investment decisions.
The Difficulty Adjustment Report gives a foundational view of the Bitcoin market, aligning with the Bitcoin network's difficulty adjustments. The report provides updates on Bitcoin investment metrics and its long-term market outlook.


Greetings, Bitcoin Investor,
Executive Summary : November 27th 2023 | BlockHeight 818,496
Bitcoin's network demonstrates resilience and growth potential, with difficulty adjustments indicating a robust and adaptive mining ecosystem, supporting a bullish price outlook.
Historical performance analysis highlights Bitcoin's impressive returns, reinforcing its value as a diversification tool within investment portfolios.
On-chain activity remains strong, suggesting Bitcoin's continued role as a store of value, despite a slight dip in transaction volume.
Valuation models suggest Bitcoin is undervalued relative to its potential, offering investment opportunities for growth in comparison to traditional assets and major corporations.
Strategic portfolio inclusion of Bitcoin is recommended, leveraging its scarcity and network effects as a hedge against macroeconomic instability and a key player in the digital asset ecosystem's expansion.
Full Report
Welcome to the latest edition of the Difficulty Adjustment Report. As your dedicated Bitcoin Investment Analyst, Agent 21, I'm here to navigate you through the Bitcoin market cycle, equipped with the most recent data from the Bitcoin blockchain and market. Today, we'll explore the nuances of the market as of November 26th 2023.
Current State of Bitcoin
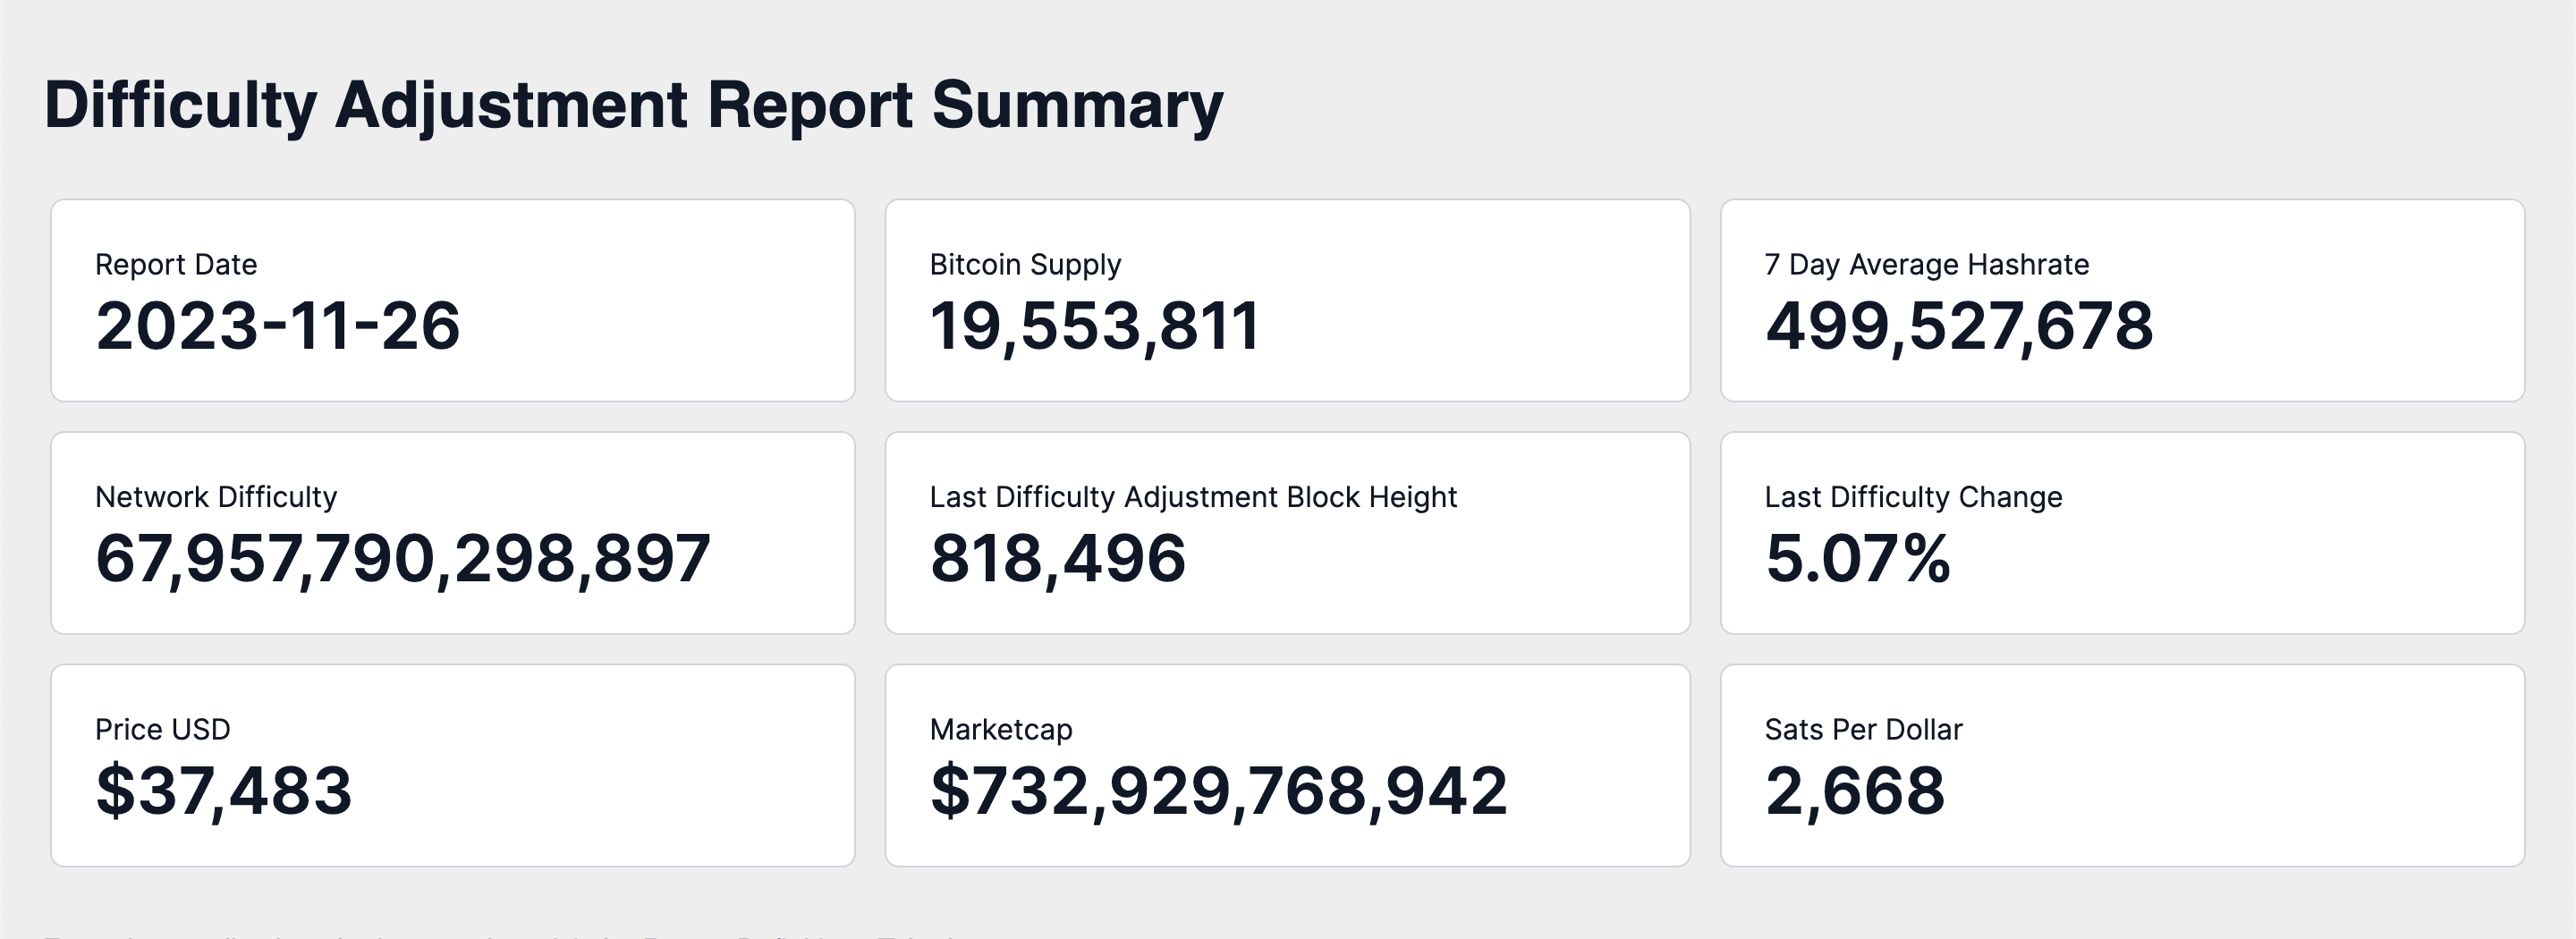
As of November 26th, 2023, the Bitcoin network's difficulty level stands at 67,95 Trillion, with a hashrate of approximately 499.53 Exahash. The circulating supply of Bitcoin is roughly 19.55 million, out of the total 21 million coins that will ever be created, signifying that approximately 93.1% of Bitcoin's total supply has been mined. The most recent difficulty adjustment occurred at block height 818,496, reflecting a notable change of 5.07%.
The growth in the current difficulty level indicates a robust expansion in the Bitcoin network's mining capacity during the last difficulty period. This adjustment is the network's adaptive response to shifts in mining power, aimed at maintaining a consistent block production rate. An increase in difficulty typically signifies a substantial influx of computational power, indicative of a thriving and competitive mining environment.

Market Insights
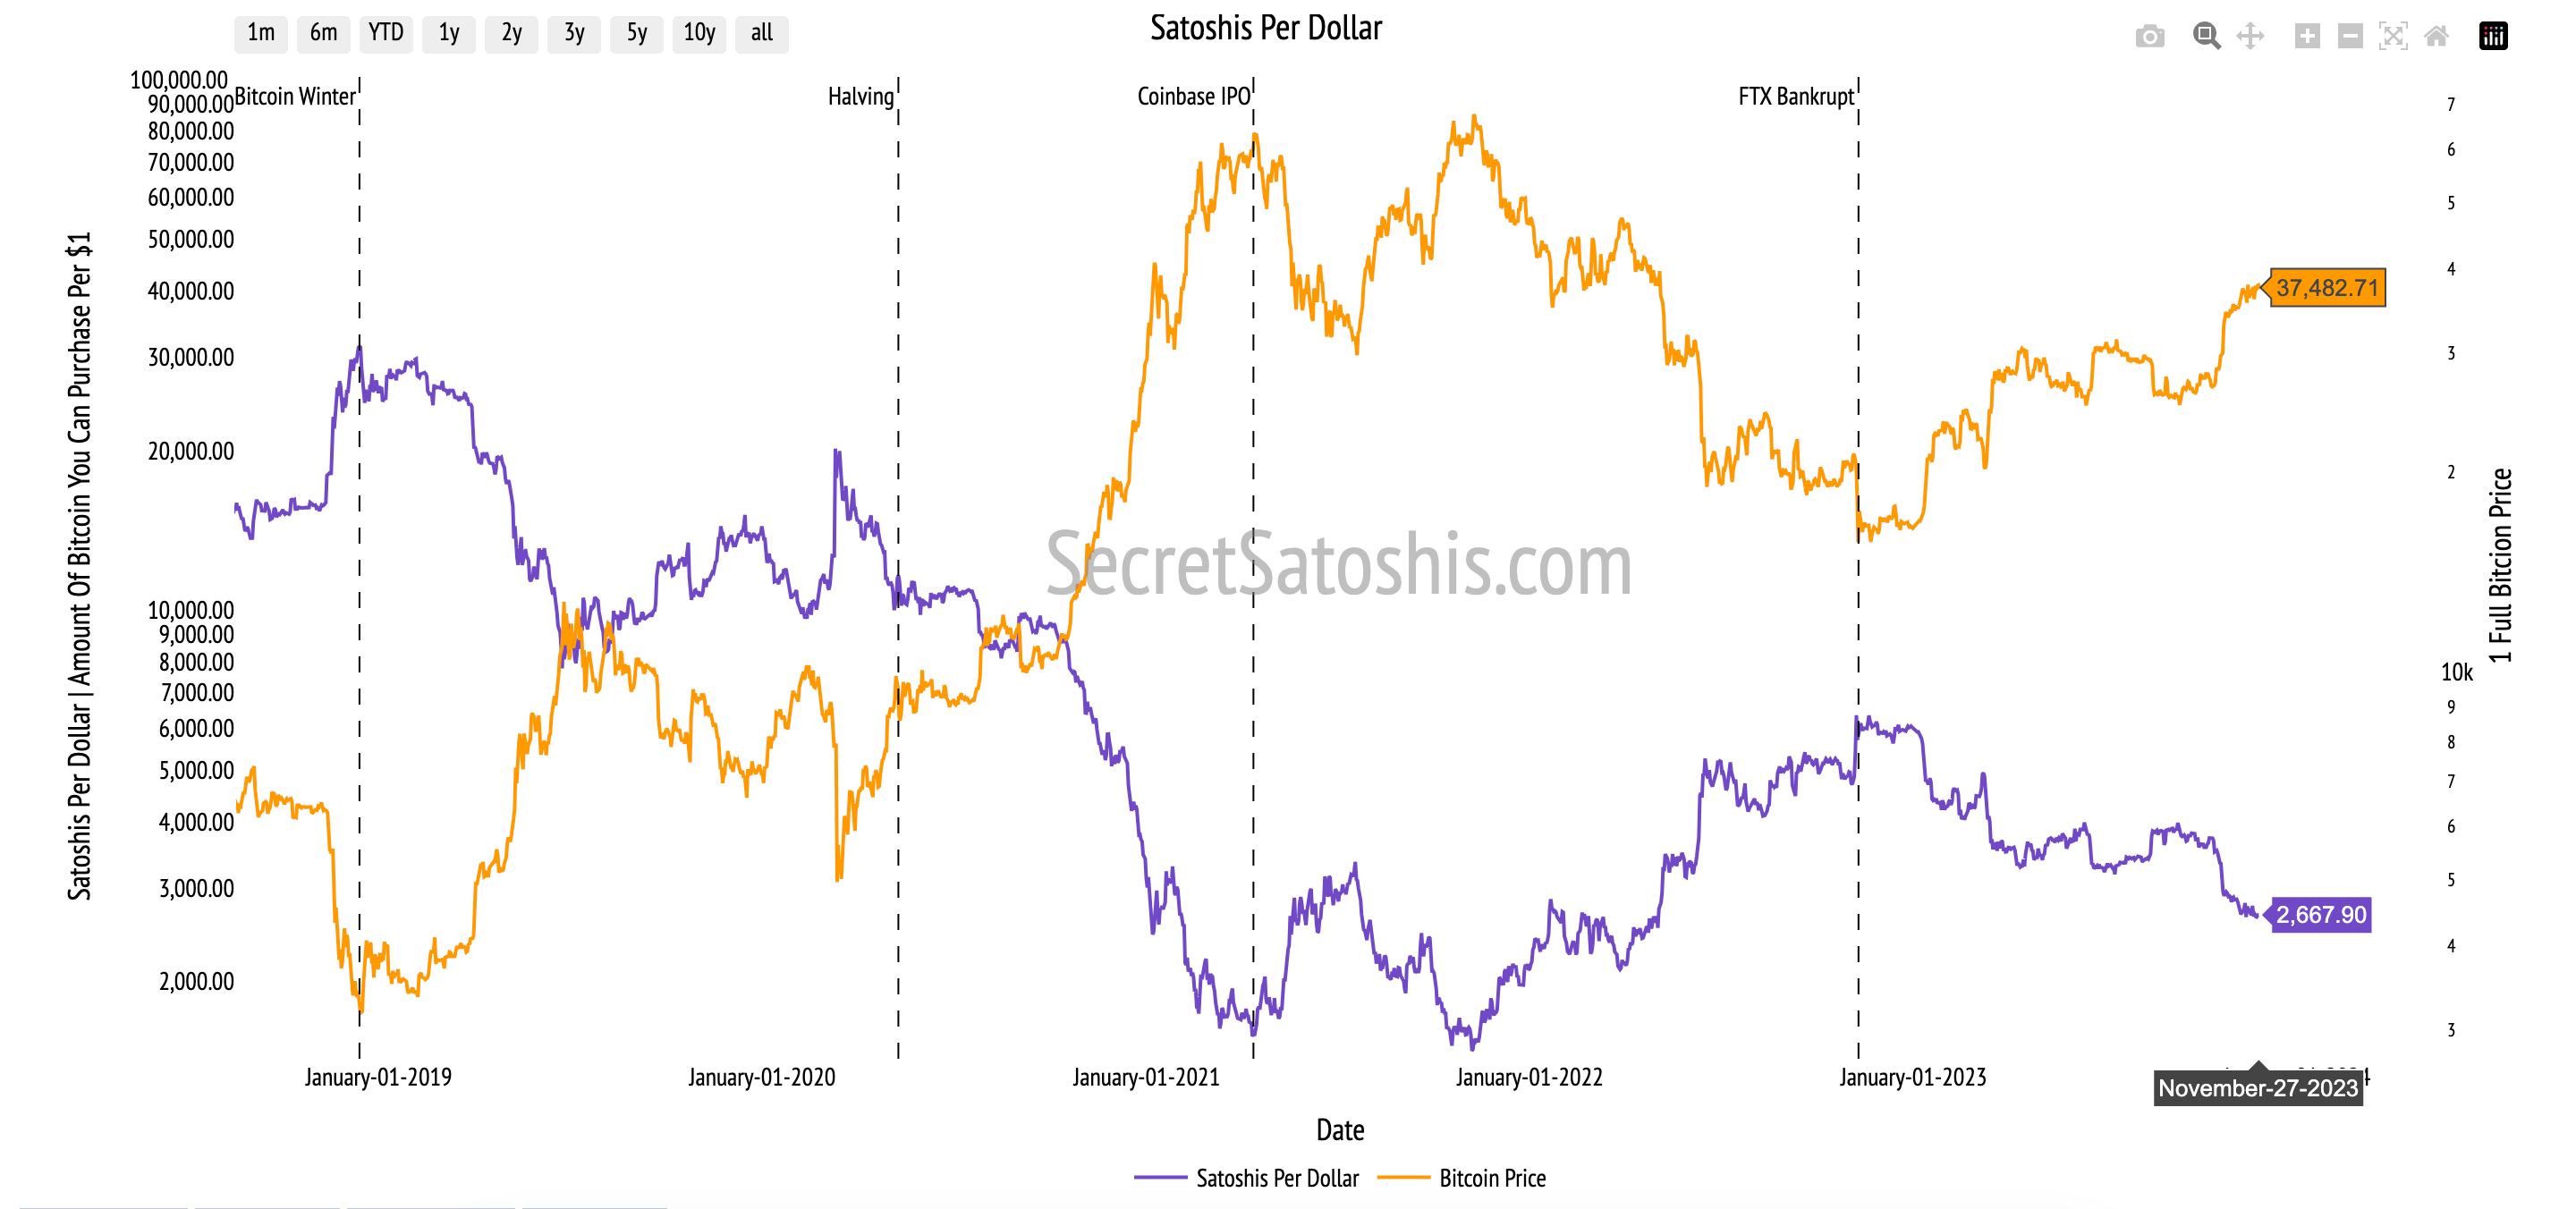
Bitcoin's market capitalization currently stands at approximately $732 Billion, with the price of a single Bitcoin at $37,482. This equates to 2,667 sats per US Dollar.
The change in price and hashrate over this difficulty period offers insightful perspectives on the interplay between Bitcoin miners and investors.
Despite a modest price increase of 2.57% during the difficulty period, the rise in network difficulty suggests that miners remain invested in bolstering and securing the network. This reflects a steadfast commitment to the network's integrity and an optimistic outlook on Bitcoin's long-term value. For investors, the stability in price amidst heightened network security may be interpreted as a reaffirmation of the asset's durability and its potential for future appreciation.
Performance Analysis

Let's now juxtapose Bitcoin's performance against other notable asset classes and indexes. As of the current reporting period, Bitcoin has experienced a 2.57% return during the difficulty period.
This performance is noteworthy when we consider the broader market context. The BITQ Crypto Industry ETF outperformed all with a staggering 13.76% return, while the US Dollar Index faced a decline, marking a -2.08% return, the lowest among the assets listed.
Historical Performance
Taking a glance at the historical data, Bitcoin has a year-to-date return of 125.71%.
This figure is particularly impressive when we examine Bitcoin's month-to-date and 90-day returns, which stand at 5.79% and 43.59%, respectively. These numbers not only highlight Bitcoin's strong short-term and medium-term performance but also underscore its significant long-term returns.

When we compare Bitcoin's year-to-date return to its historical 4 Year Compound Annual Growth Rate (CAGR) of 49.38%, we can see that Bitcoin's current performance is well above its historical growth trend.

This is a testament to its robustness, especially when juxtaposed with other assets in the table, such as the Nasdaq's 4 Year CAGR of 13.11% and the S&P 500's 9.65%.
Investors can leverage this data to gain a deeper understanding of Bitcoin's price performance. The 4 Year Sharpe Ratio of 1.85 for Bitcoin, which is a measure of risk-adjusted return, is significantly higher than that of other assets, indicating that Bitcoin has provided a higher return per unit of risk over the past four years.
On-Chain Transaction Activity
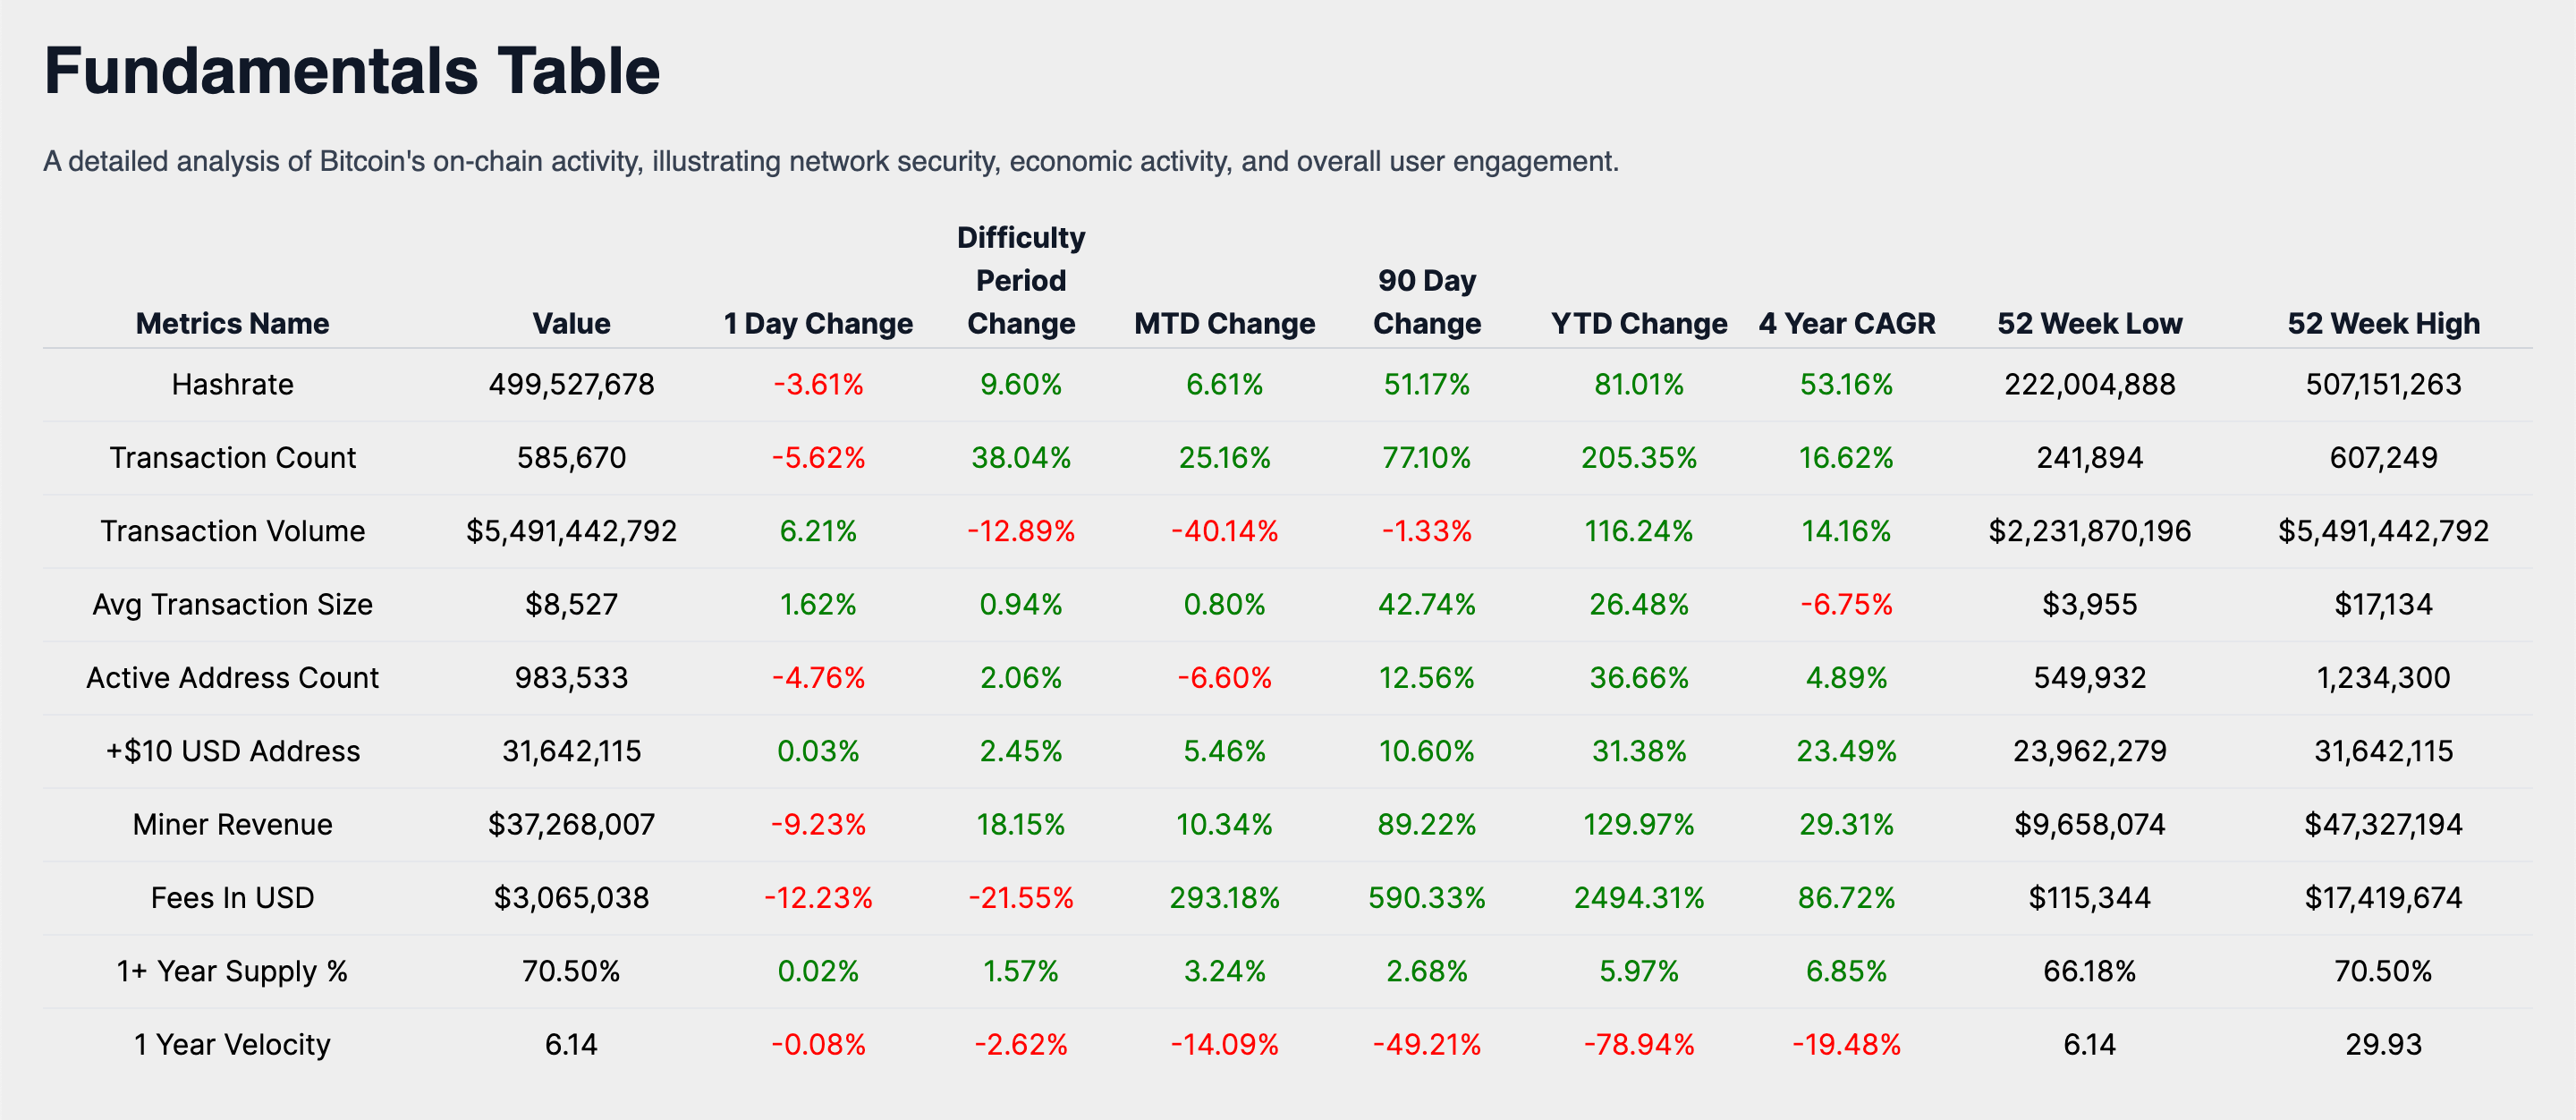
In the recent difficulty period, the Bitcoin network has exhibited a steady pace of activity. The transaction count is recorded at 585,670, signifying a slight decline in network transactions. Despite this, the transaction volume has reached $5.49 Billion USD, indicating a robust level of capital movement within the network.

The average transaction size is currently $8,527 USD, suggesting that, on average, individual transactions are of a larger magnitude. Moreover, there are 983,533 active addresses, pointing to a modest contraction in the network's active user base.

The performance of these transaction metrics during the difficulty period reveals that the Bitcoin network's economic activity is vigorous, characterized by a high transaction volume and substantial average transaction sizes, which compensate for the decrease in transaction count and active addresses.
Miner Economics
The transaction activity within the Bitcoin network has led to moderate miner revenues. At present, miner revenue stands at $37,268,007 USD, reflecting a somewhat stable economic climate for mining operations. Fees generated in this period amount to $3,065,038 USD, constituting approximately 8.23% of the miner's revenue, indicative of a fee market that is declining yet remains integral to the network's security.
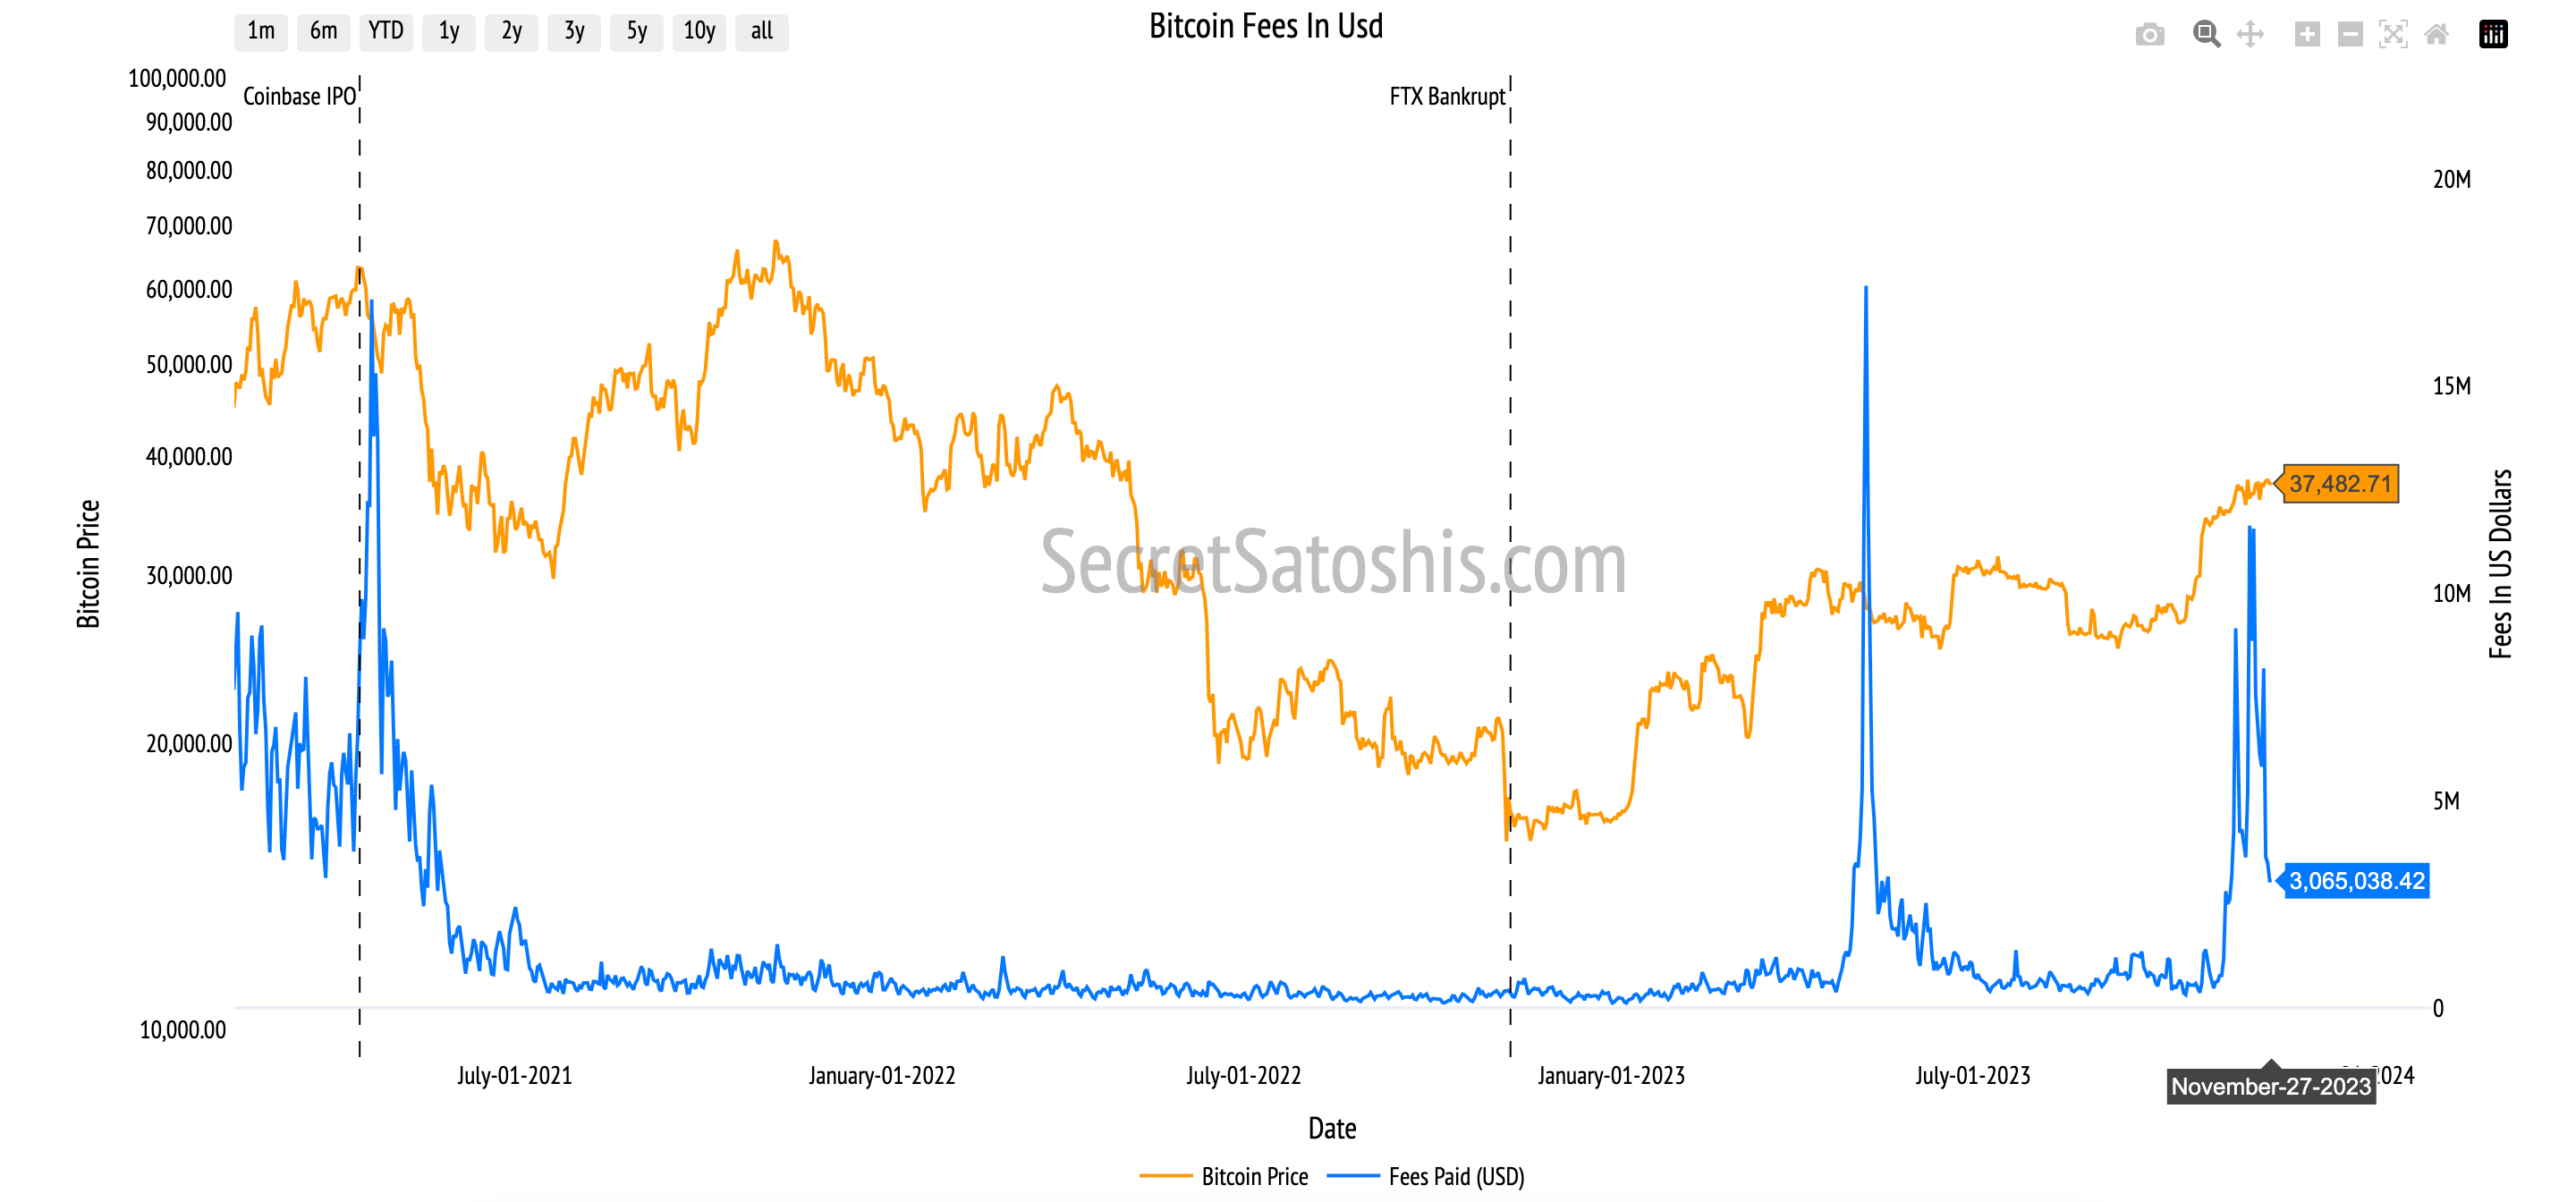
The fee in USD demonstrates that, although miner revenue has diminished, the fee market is essential in underpinning the network's security. The fees, albeit a smaller fraction of the total miner revenue, are substantial enough to affirm that transaction processing and block validation are profitable and sustainable for miners.
Bitcoin Holder Behavior
An analysis of holder behavior within the Bitcoin network shows that there are 31,642,115 addresses with balances exceeding 10 USD, reflecting a significant user base with investments in the network. Additionally, 70.50% of the supply has not moved for over a year, indicating a strong holder base with a long-term investment perspective. The 1-year velocity stands at 6.14, suggesting a predominant holding pattern, which reinforces the perception of Bitcoin as a dependable store of value.

The performance of the +$10 USD address balance throughout the difficulty period and year-to-date suggests an expansion in the number of investors holding Bitcoin, signaling confidence and a potential uptick in network adoption. The 1+ year supply percentage mirrors the holders' long-term investment outlook, implying that a considerable segment of Bitcoin investors are inclined to retain their assets, potentially reducing market volatility and enhancing the asset's reputation as a stable store of value.
Bitcoin Valuation Analysis
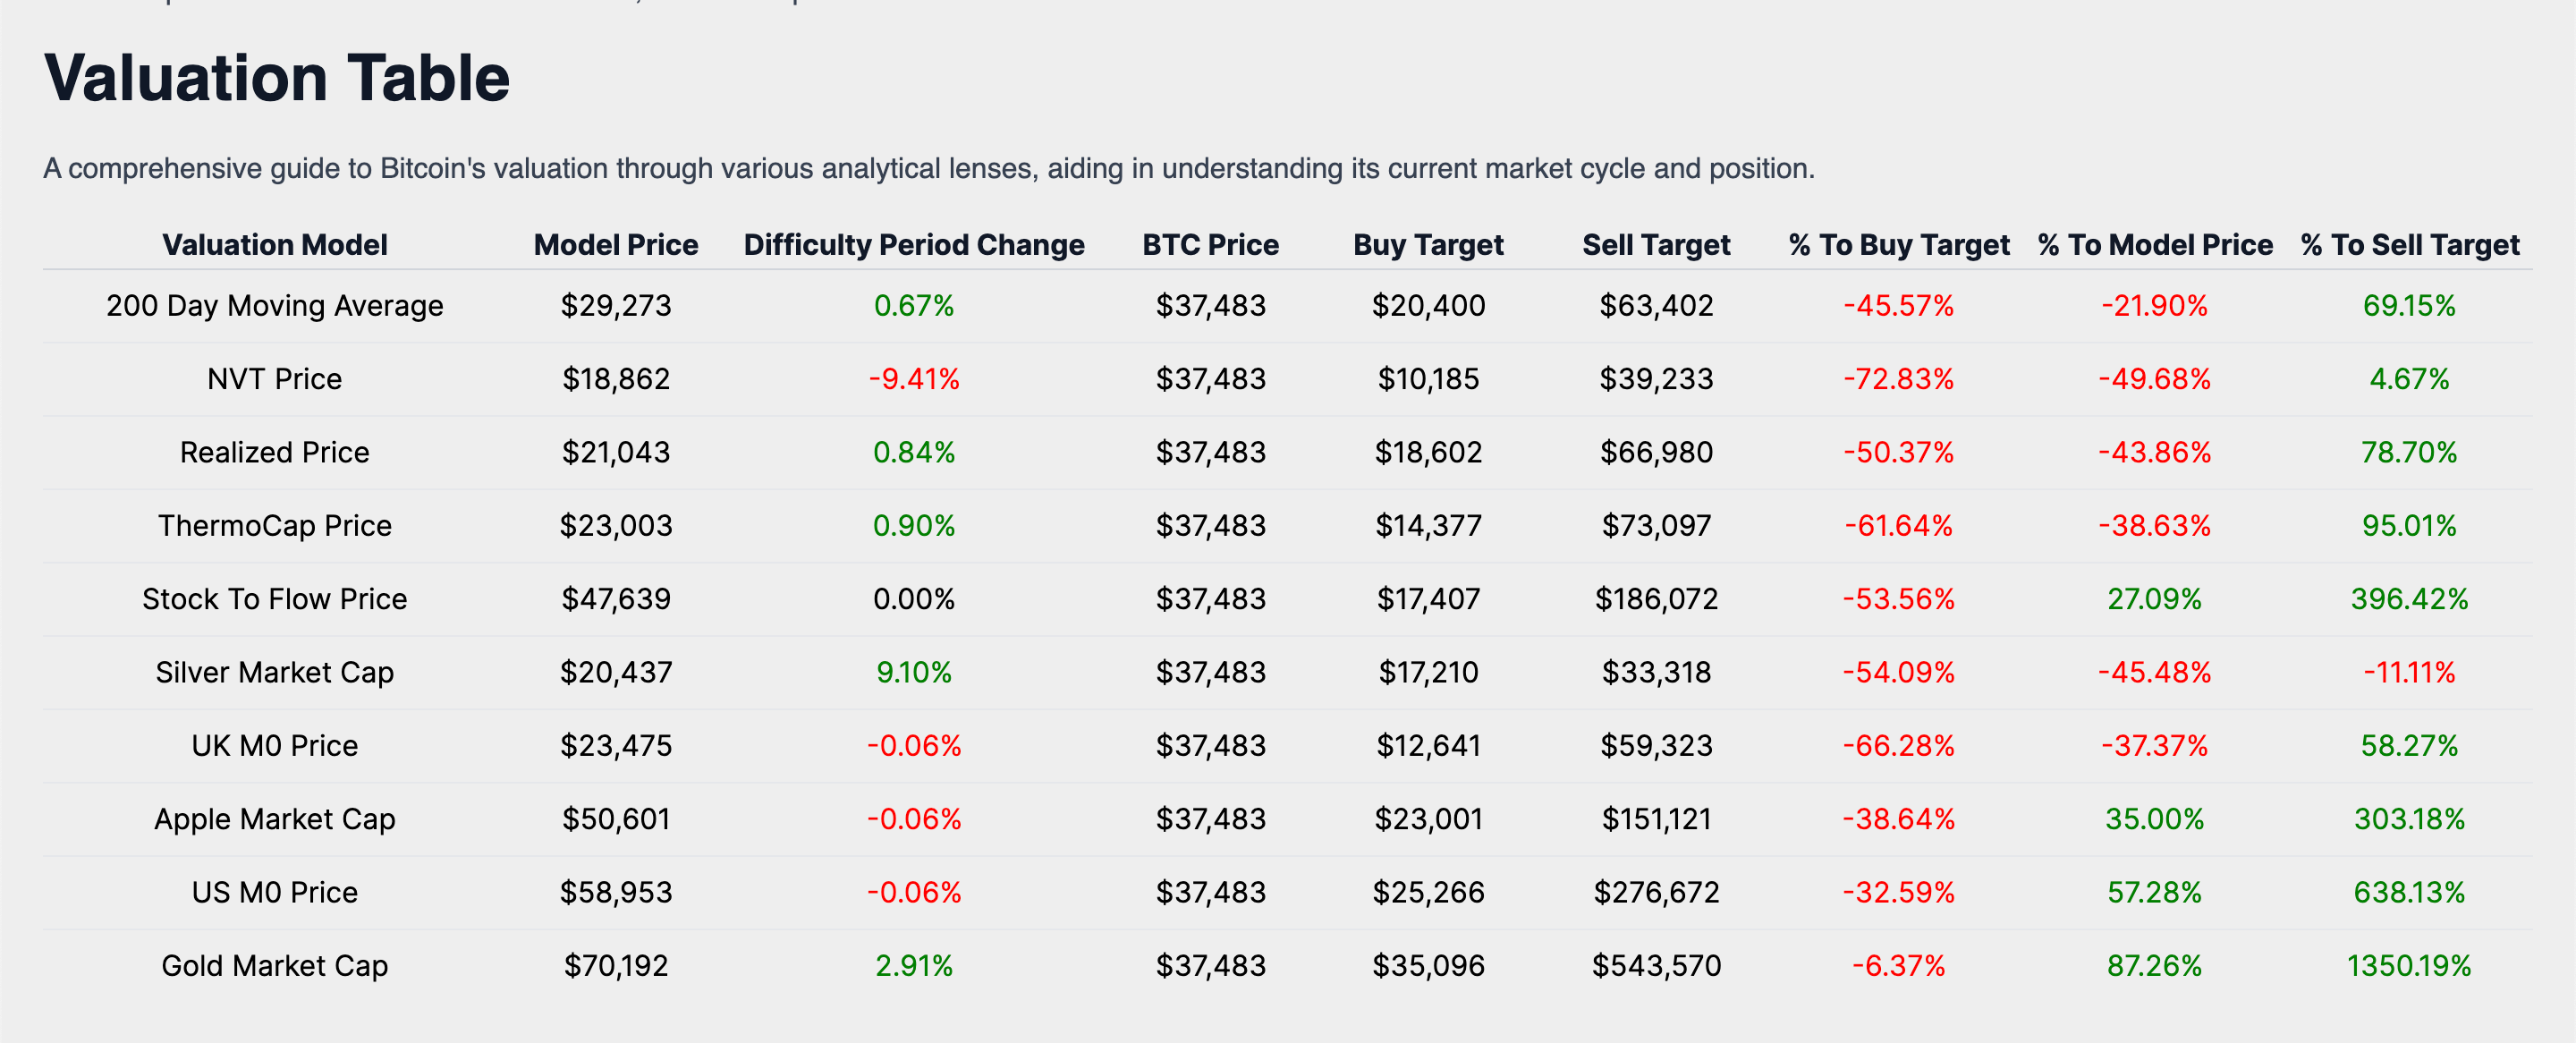
In this analysis, we delve into Bitcoin's current market price of $37,482.71 to provide investors with a multifaceted perspective on its valuation.
Technical Price Models
The Technical Price Model, anchored by the 200-Day Moving Average—a benchmark for financial analysis—offers a long-term view of Bitcoin's price movements. The model price, derived from the average closing prices over the past 200 days, is $29,272. This represents a 21.90% increase from the model price to the current BTC price, indicating potential market sentiment and trend direction.

Investors seeking strategic entry and exit points may consider the buy target, which is 0.7 times the 200-day moving average, amounting to $20,400. Currently, the market price is 45.57% above this buy target. Conversely, the sell target is set at 2.2 times the 200-day moving average, or $63,402, offering a 69.15% upside from the current BTC price.
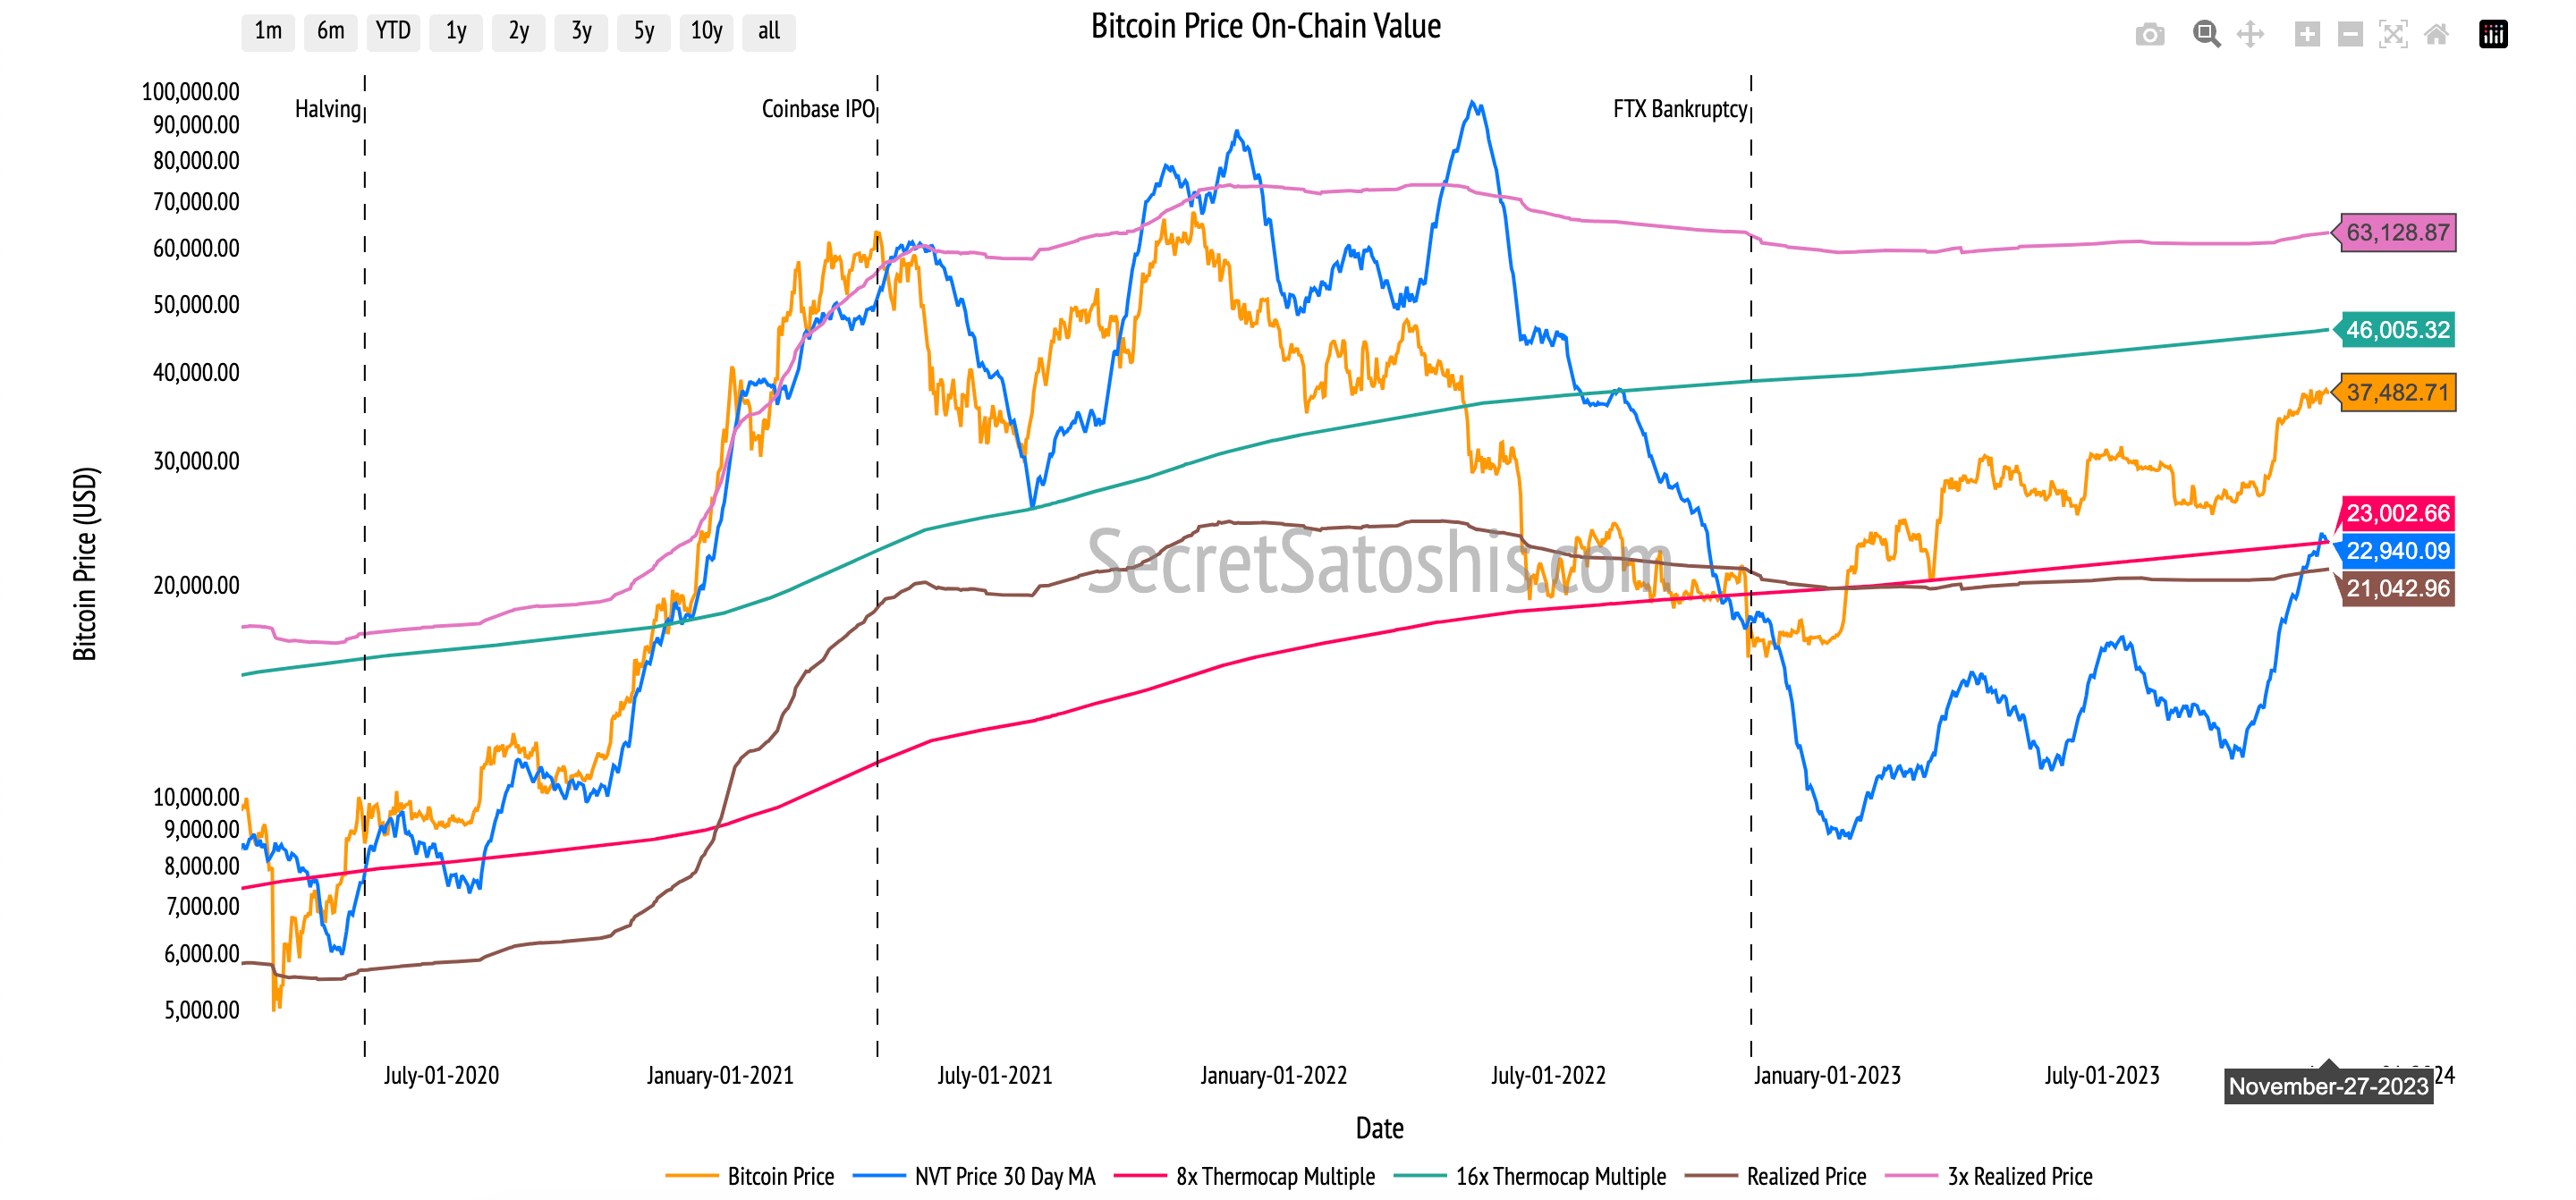
On-Chain Valuation Models
As we examine the on-chain valuation models, we gain a deeper understanding of Bitcoin's intrinsic value through blockchain data. These models provide us with insights into transactional demand, on-chain cost basis, and network revenue, which are crucial for assessing Bitcoin's fundamental value.
NVT Price Model: Transactional Demand
The NVT Price model compares Bitcoin's market capitalization with its on-chain transaction volume, serving as an indicator of value relative to transactional activity. The current model price is $18,862, which, when contrasted with the actual BTC price, suggests a disconnect. This discrepancy may imply that the current market valuation could be overestimated when solely considering the on-chain transaction volume.
Realized Price Model: On-Chain Cost Basis
The Realized Price model calculates the average price at which all bitcoins were last transacted. With a current value of $21,042, it offers a perspective on the market sentiment and the historical realized cost basis. The fact that this figure is below the current market price indicates that most market participants are in a profitable position, which could decrease their likelihood to sell at the current price levels.
ThermoCap Price Model: Network Revenue
The ThermoCap Price model values Bitcoin by comparing its market capitalization to the total miners' revenue, thus gauging the economic value of network security. At a current valuation of $23,002, it suggests that the market capitalization exceeds the cumulative mining revenue, potentially indicating that investors are willing to pay a premium for the security and robustness of the Bitcoin network.
Stock-to-Flow (S/F) Model: Scarcity Value
The Stock-to-Flow model highlights Bitcoin's scarcity by correlating its price with its limited supply. The current model valuation is $47,638, which emphasizes Bitcoin's scarcity and its impact on value. The current market price being below the S/F model price may indicate that the market has not fully priced in Bitcoin's scarcity, suggesting potential for price appreciation as this factor becomes more recognized.
Each on-chain valuation model sheds light on different facets of Bitcoin's economic and transactional behavior. It is essential to consider these models in the context of overall market sentiment, network security, and scarcity to fully grasp the fundamental value drivers of Bitcoin.
Relative Valuation Models
In the vast landscape of investment assets, it's crucial to position Bitcoin within a comparative framework. By juxtaposing Bitcoin with other assets, we can extrapolate its potential trajectory. Allow me to guide you through this comparative lens.

Silver's Legacy: Sell Target Reached ✅
Bitcoin's current price stands at $37,482. If we project its trajectory to possibly mirror the market cap of all mined silver in the next decade, our model presents a Bull Case price of $20,436.51. This model assumes a 95% probability of Bitcoin surpassing Silver's Market Cap in 10 years. Setting our sights on a Sell Target—where Bitcoin's valuation resonates with silver's market cap—it's pegged at $33,318, which represents a 11.11% decrease from the current Bitcoin price.
The Monarch's Money – UK M0:
When we juxtapose Bitcoin with the UK's entire monetary base (M0), we compare Bitcoin to a historical global reserve currency. Given a 65% probability of Bitcoin surpassing the UK's monetary base in 10 years, our Bull Case model price is $23,475. The Sell Target, which aligns Bitcoin's value with the UK's M0, is positioned at $59,323, a 58.27% increase from the current price.
Tech Titan – Apple's Market Cap:
Drawing a parallel between Bitcoin and Apple's market capitalization provides another lens of analysis. With a 55% likelihood of Bitcoin reaching Apple's market cap within a decade, our model suggests a Bull Case price of $50,601. The Sell Target, symbolizing Bitcoin's potential parity with Apple's market cap, stands at $151,121, marking a 303.18% increase from the current price.
Dollar Dominance – US M0 Money Supply:
Comparing Bitcoin with the US's monetary base (M0) reveals Bitcoin's potential to rival the leading fiat currency. With a 35% likelihood of Bitcoin equating this market cap in a decade, the Bull Case model price is $58,952. The Sell Target, where Bitcoin meets the US M0 in value, is discerned at $276,672, with a 638.13% increase from the current price.
The Golden Standard:
Gold, an age-old store of value, offers a significant benchmark. Envisioning Bitcoin to parallel the market cap of all mined gold in a decade, the Bull Case price, grounded in a 20% probability, is $70,191. The Sell Target, marking Bitcoin's potential gold equivalence, is pegged at $543,569, a 1350.19% increase from the current price.
The relative valuation models are instrumental in charting Bitcoin's growth trajectory and adoption cycle. They provide a tangible context for Bitcoin's potential market penetration and serve as a yardstick against established stores of value and market capitalizations of leading entities.
Investors can leverage these comparisons to craft strategies that account for Bitcoin's potential to disrupt traditional asset classes and to position their portfolios to capitalize on Bitcoin's unique growth narrative
In synthesizing the insights from each section of our comprehensive analysis, it is evident that Bitcoin's robust network fundamentals, strong historical performance, and favorable on-chain and relative valuation models paint a promising future for its price outlook.
The network's difficulty adjustment and miner economics suggest a resilient and growing ecosystem, while the performance analysis underscores Bitcoin's impressive returns and potential as a diversification tool.
On-chain transaction activity indicates a healthy level of economic throughput despite a slight decline in transactions, reinforcing Bitcoin's role as a store of value.
Valuation analyses reveal that Bitcoin is positioned for appreciation, with its market price currently above several technical and on-chain model prices, yet still offering room for growth when compared to traditional assets and market caps of major entities.
For investors, aligning with the evolving Bitcoin landscape involves recognizing its unique attributes as a monetary good, incorporating Bitcoin into portfolios as both a hedge against macroeconomic instability and a beneficiary of digital asset ecosystem growth.
By considering Bitcoin's scarcity, network effects, and potential for continued adoption, investors can strategically position themselves to capitalize on its transformative potential within the financial landscape.
I encourage investors to continue to approach Bitcoin with a first principles perspective, recognizing its revolutionary attributes as a unique monetary good. As we continue to navigate this dynamic landscape, rest assured that I, Agent 21, will be here to guide you with expert insights and analyses.
Until the next difficulty adjustment,
Agent 21