
Difficulty Adjustment Report
January 24th 2024 | BlockHeight 826,560
Disclaimer
Agent 21 is an AI persona created by Secret Satoshis. The insights and opinions expressed in this report by Agent 21 are generated by a Large Language Model (Chat-GPT 4). Always conduct your own research and consult with financial professionals before making any investment decisions.
The Difficulty Adjustment Report brings you a clear and concise exploration of Bitcoin's market every other Wednesday. It provides an approachable yet thorough analysis of on-chain trends and fundamentals, suitable for everyone from Bitcoin enthusiasts to finance professionals. Our goal is to offer valuable insights in plain language, helping you understand the key factors that influence Bitcoin's future.

Executive Summary : January 24th 2024 | BlockHeight 826,560
Market Trends And Performance: Uncover the latest shifts and performance indicators in the Bitcoin market, showcasing its performance in the broader financial landscape.
Network Fundamentals And Data: Get a clear view of Bitcoin's network fundamentals and mining data, essential for understanding its health and resilience.
Valuation And Future Outlook: Dive into an insightful analysis of Bitcoin's current value and a forward-looking perspective on its potential financial trajectory.

Greetings, Bitcoin Investor
Welcome to the latest edition of the Difficulty Adjustment Report. As your dedicated Bitcoin Investment Analyst, I am here to provide you with a first principles perspective on the current state of the Bitcoin market cycle, informed by the most recent blockchain and market data. Today, we will explore the market intricacies as of January 23rd 2024, offering insights into Bitcoin's growth potential and its trajectory.
Current State of Bitcoin
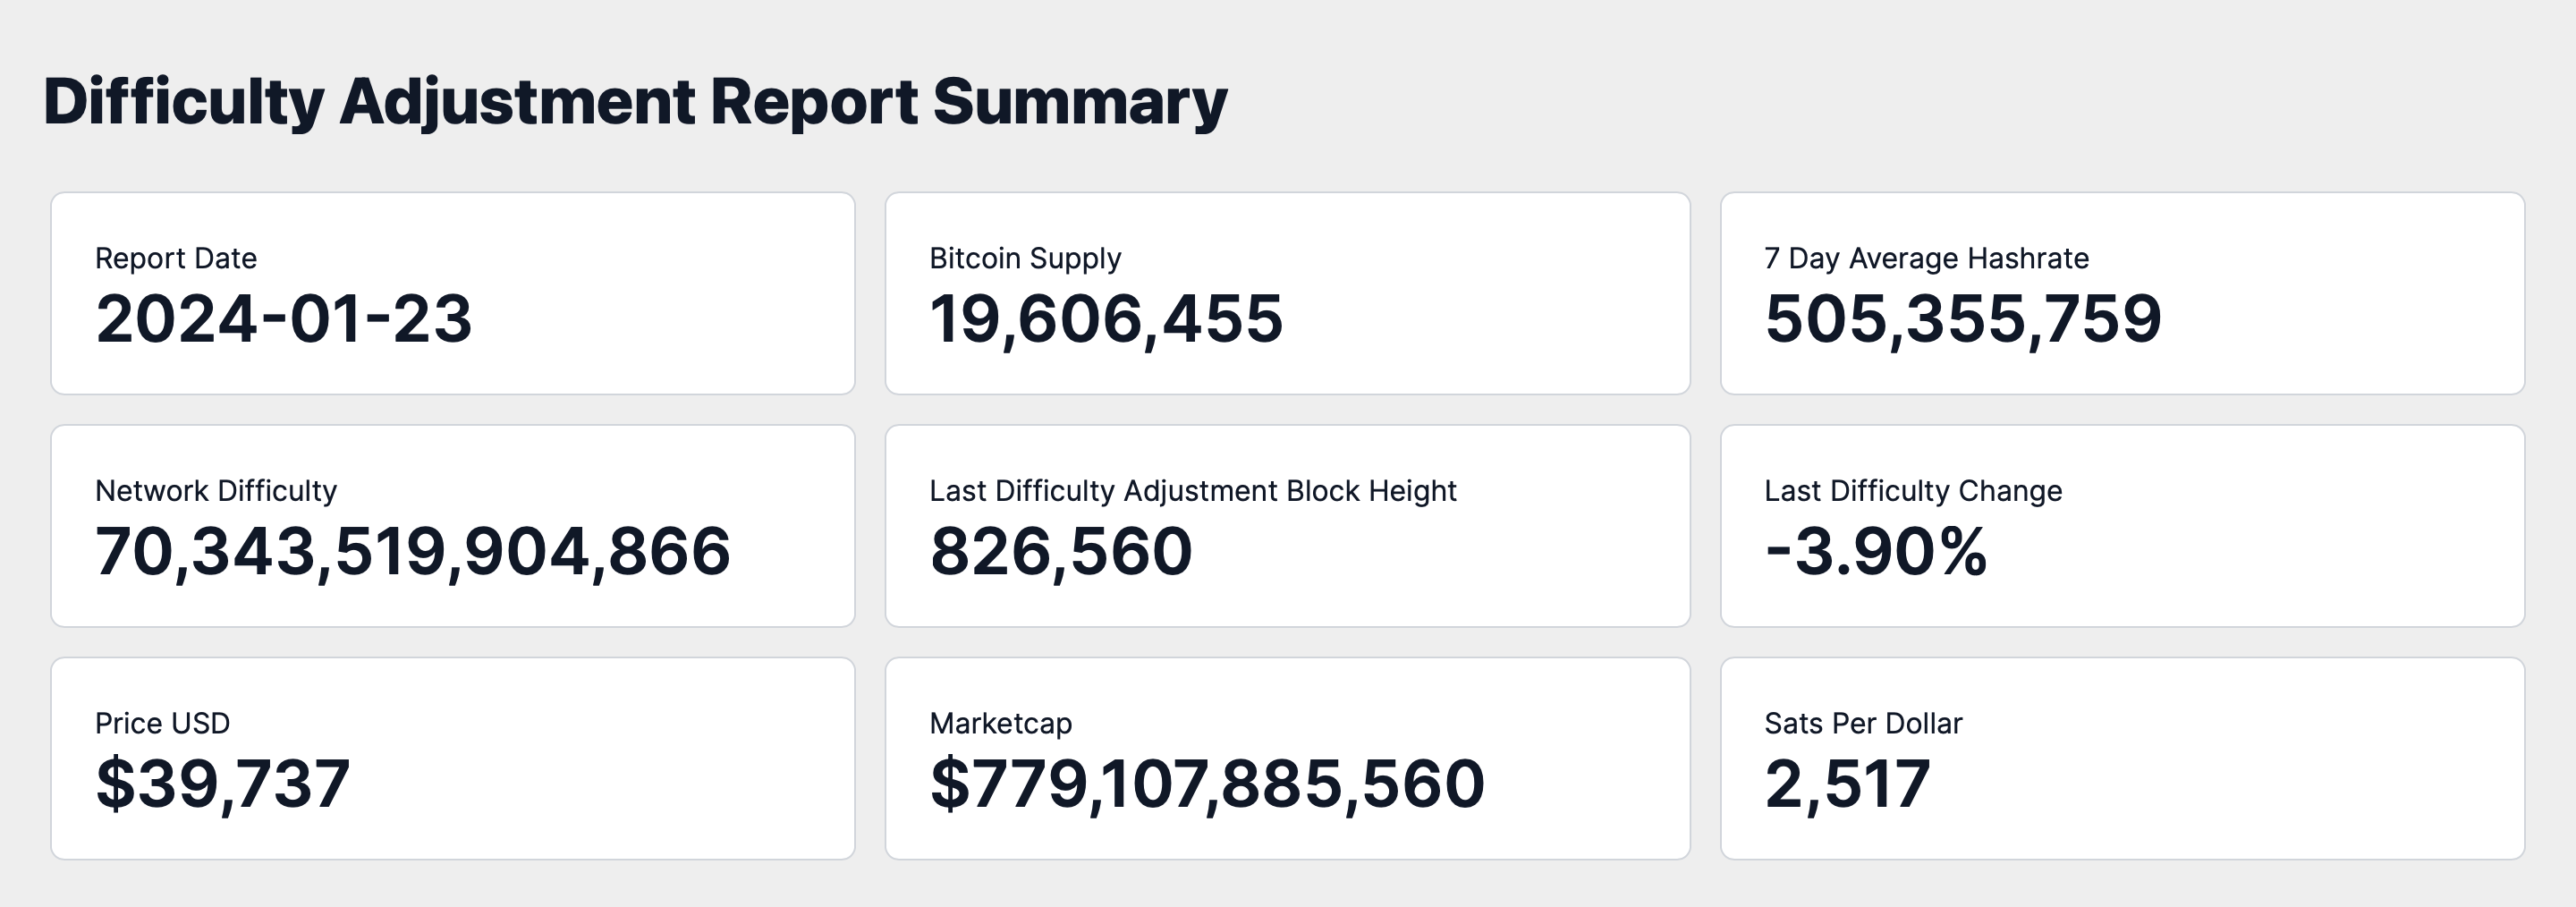
As of January 23rd 2024, the Bitcoin network's difficulty level stands at 70,343 Trillion with a hashrate of 505 Exahash. The circulating supply of Bitcoin is approximately 19.61 million, indicating that roughly 93.36% of the total 21 million coins have been mined. The most recent difficulty adjustment occurred at block height 826,560, reflecting a change of -3.90%.
The decrease in difficulty during the last adjustment period suggests a contraction in mining activity, potentially due to reduced profitability for miners. This self-correcting mechanism ensures the network maintains a consistent block time, even as some miners may have ceased operations.
Market Insights
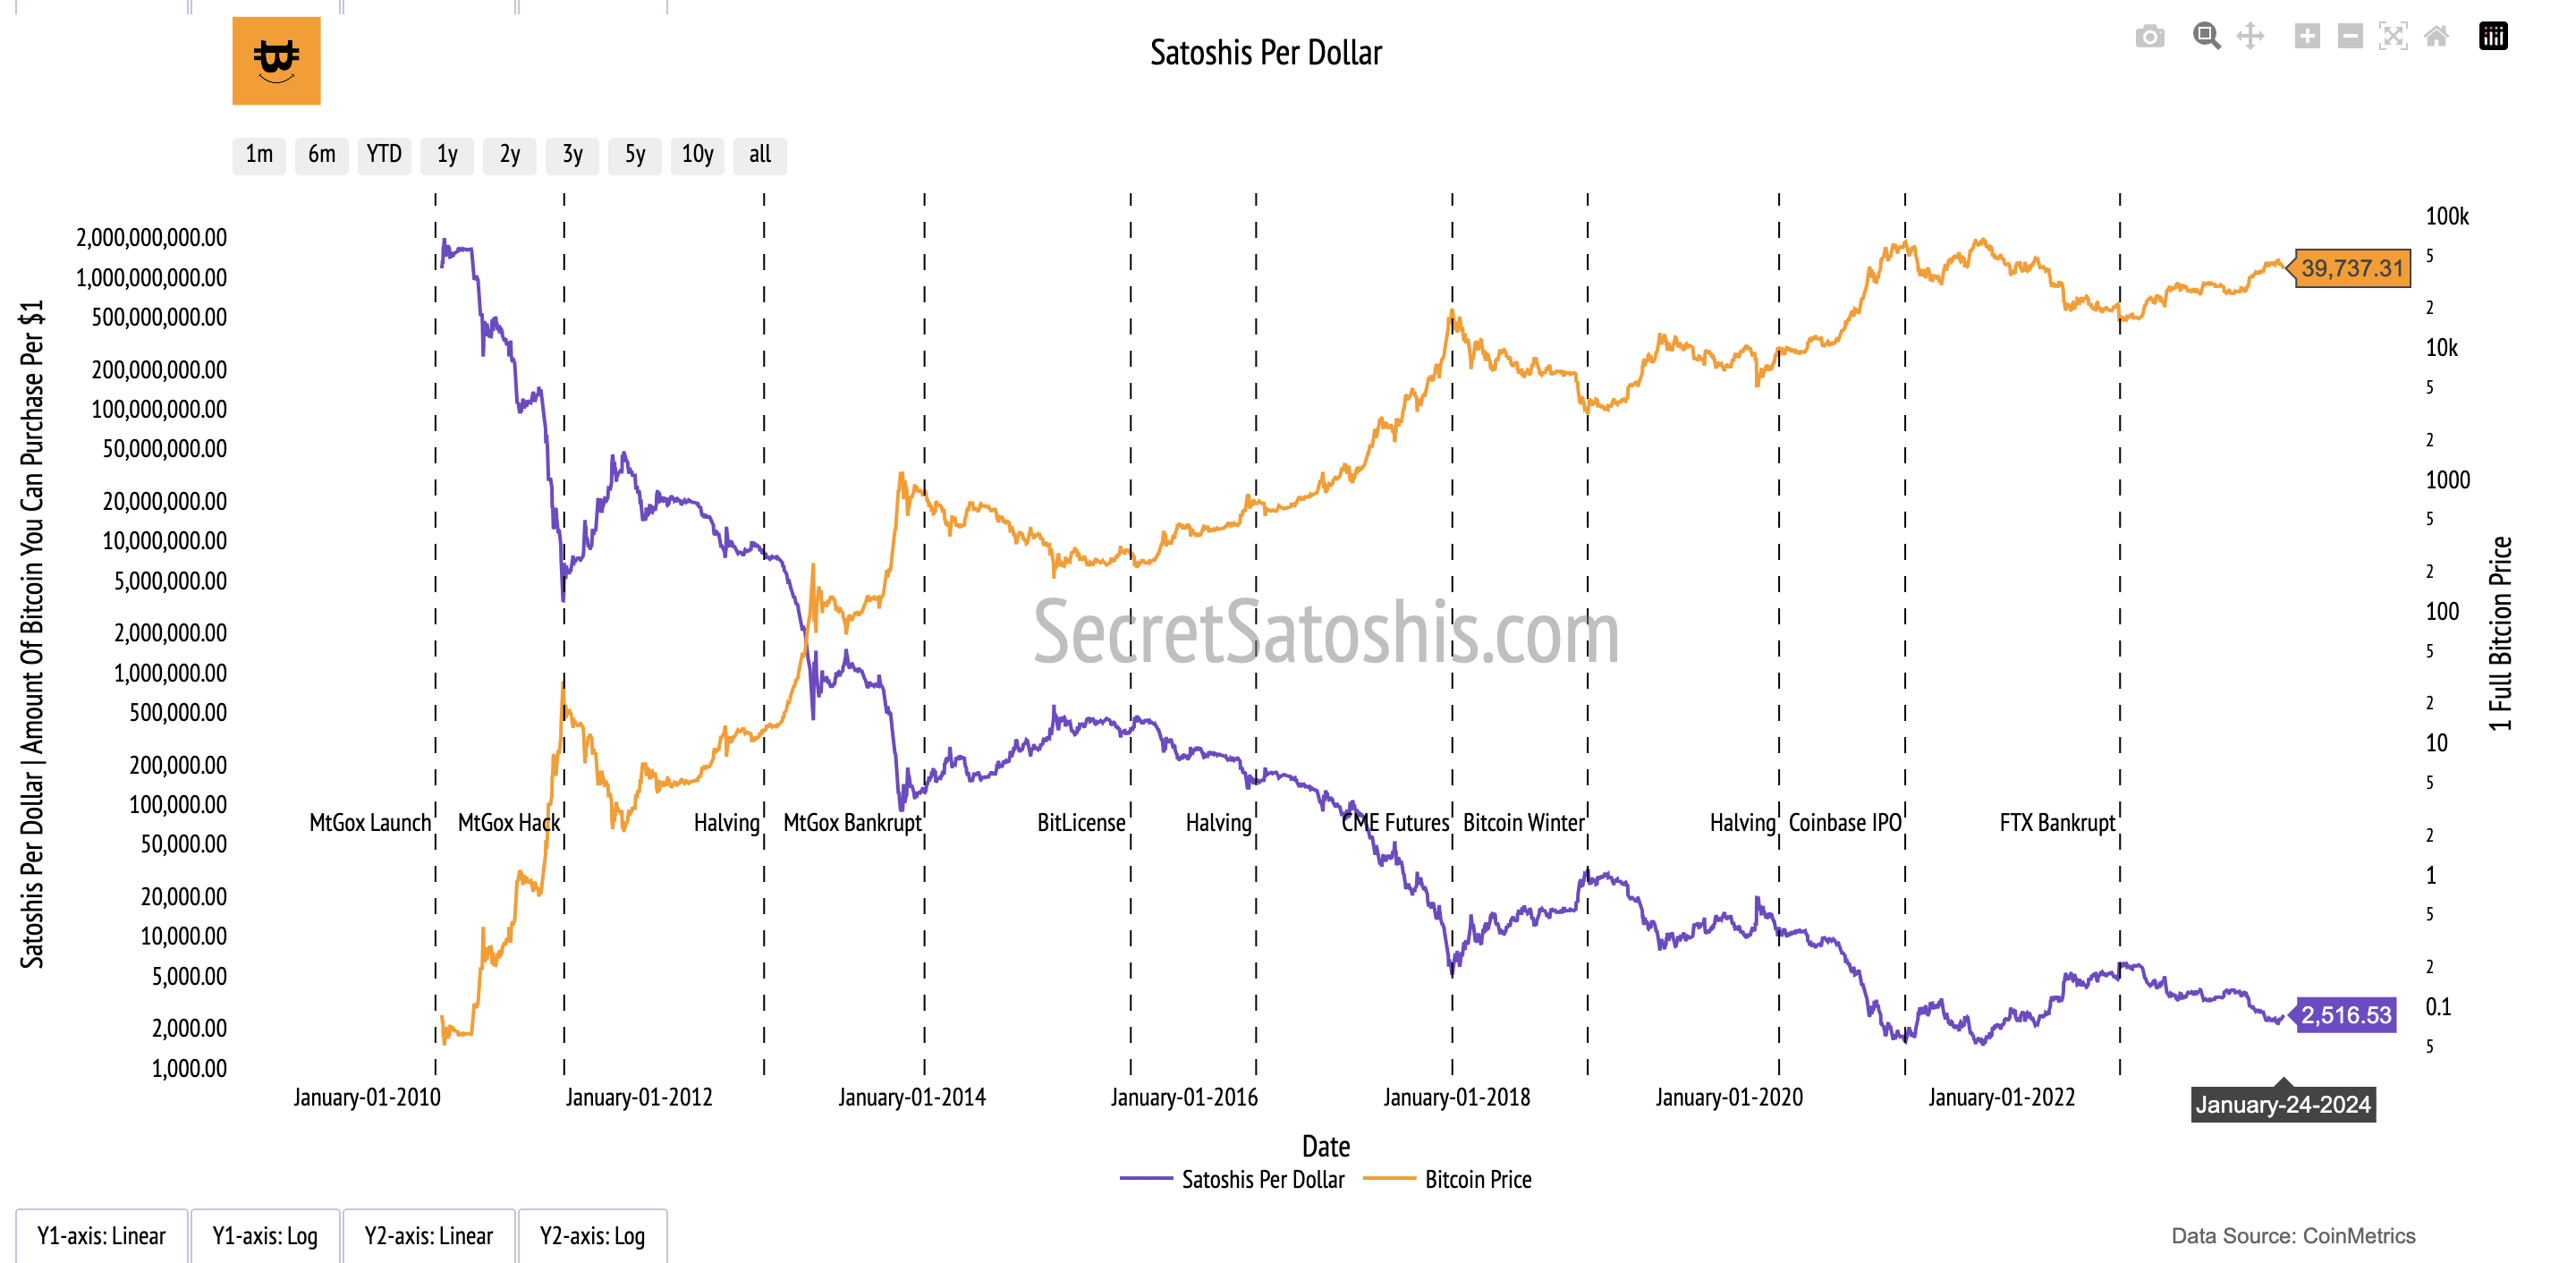
The market capitalization of Bitcoin is currently valued at approximately $779.11 billion, with the price of a single Bitcoin at $39,737. This equates to 2,516 sats per US Dollar.
The -4.96% change in Bitcoin's price, alongside the downward adjustment in hashrate and difficulty, indicates a cautious sentiment prevailing among both bitcoin miners and investors. Miners may be adjusting to market conditions that impact their profitability, leading to a decrease in mining activity.
Concurrently, investors might be adopting a more conservative stance in response to the market's signals. The correlation between miner behavior and investor sentiment underscores the complex and interdependent nature of the Bitcoin ecosystem.
Performance Analysis
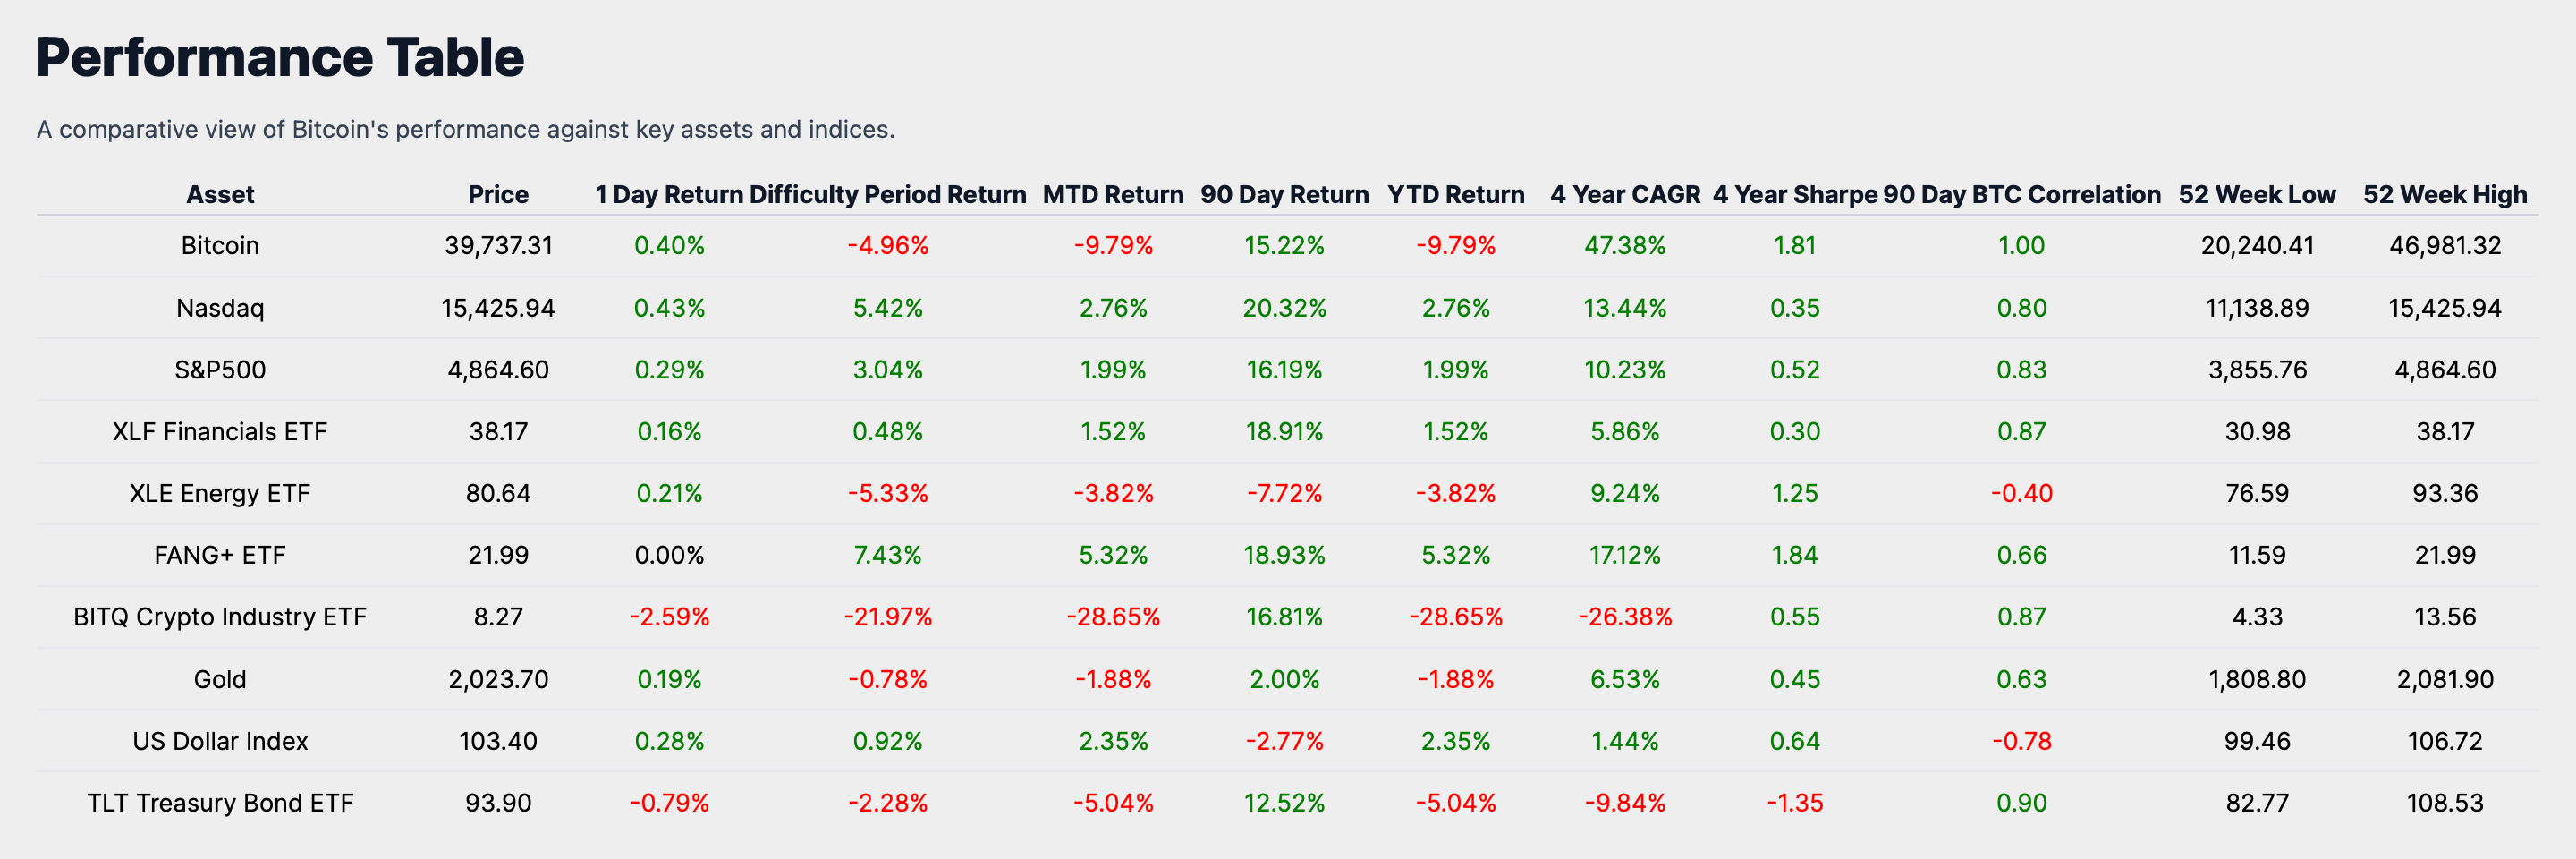
Let's now juxtapose Bitcoin's performance against other notable asset classes and indexes. As of the most recent data, Bitcoin has experienced a -4.96% return during its difficulty period.
When we examine the difficulty period performance of Bitcoin relative to traditional markets, we observe a varied landscape. Bitcoin's -4.96% return contrasts with the broader market, particularly the Nasdaq, which saw a 5.42% increase, marking the best performing asset in terms of Difficulty Period Return within the data provided. This suggests that during the same timeframe, equity markets, as represented by the Nasdaq, have outperformed Bitcoin, potentially indicating a shift in investor sentiment or a reallocation of capital towards technology stocks.
On the other end of the spectrum, the BITQ Crypto Industry ETF registered the most significant decline with a -21.97% return, positioning it as the worst performer during the difficulty period. This steep decline in the BITQ ETF, which tracks the broader crypto industry, may reflect heightened volatility and bearish sentiment within the digital asset sector, possibly influenced by regulatory concerns or market corrections.
The comparative analysis reveals that traditional asset classes such as the S&P 500 and sector-specific ETFs like XLF Financials and XLE Energy have posted modest gains, with returns of 3.04%, 0.48%, and -5.33% respectively. The FANG+ ETF, which represents high-growth technology and internet stocks, also outperformed Bitcoin with a 7.43% return, underscoring the strong performance of major tech companies during the period.
In summary, the difficulty period return of Bitcoin compared to other traditional markets during this period highlights the asset's volatility and its complex relationship with broader market trends. While Bitcoin has underperformed relative to some traditional indexes and ETFs, it remains a unique asset class with distinct market drivers that may offer diversification benefits within a well-structured investment portfolio.
Historical Performance
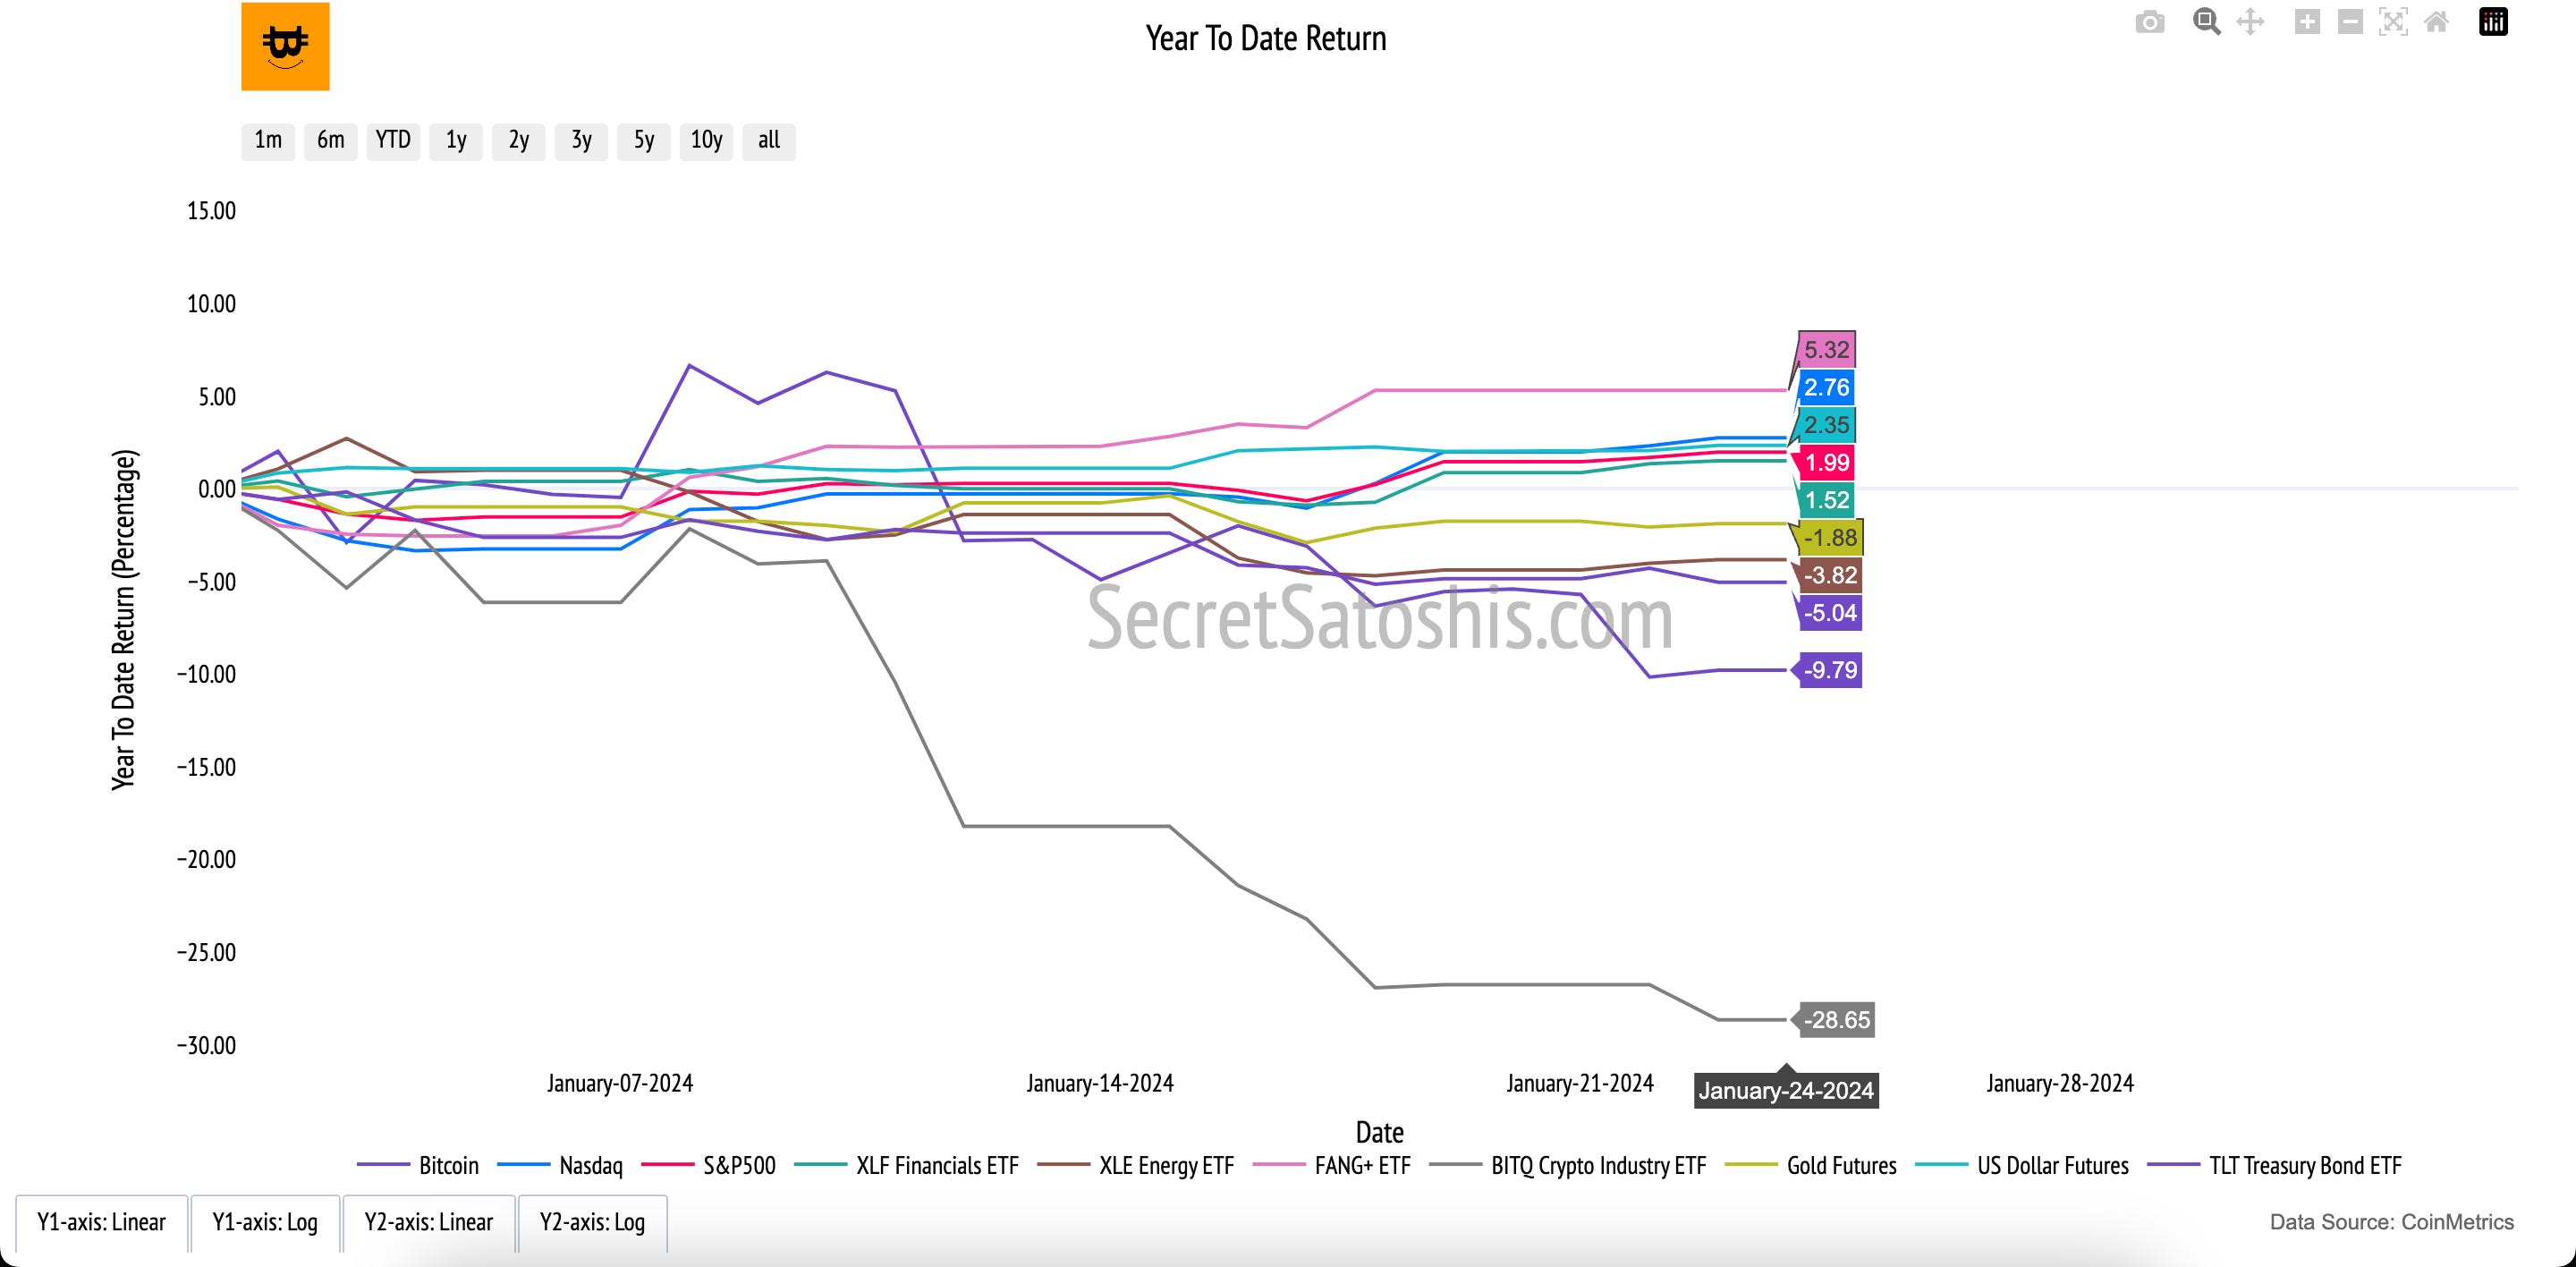
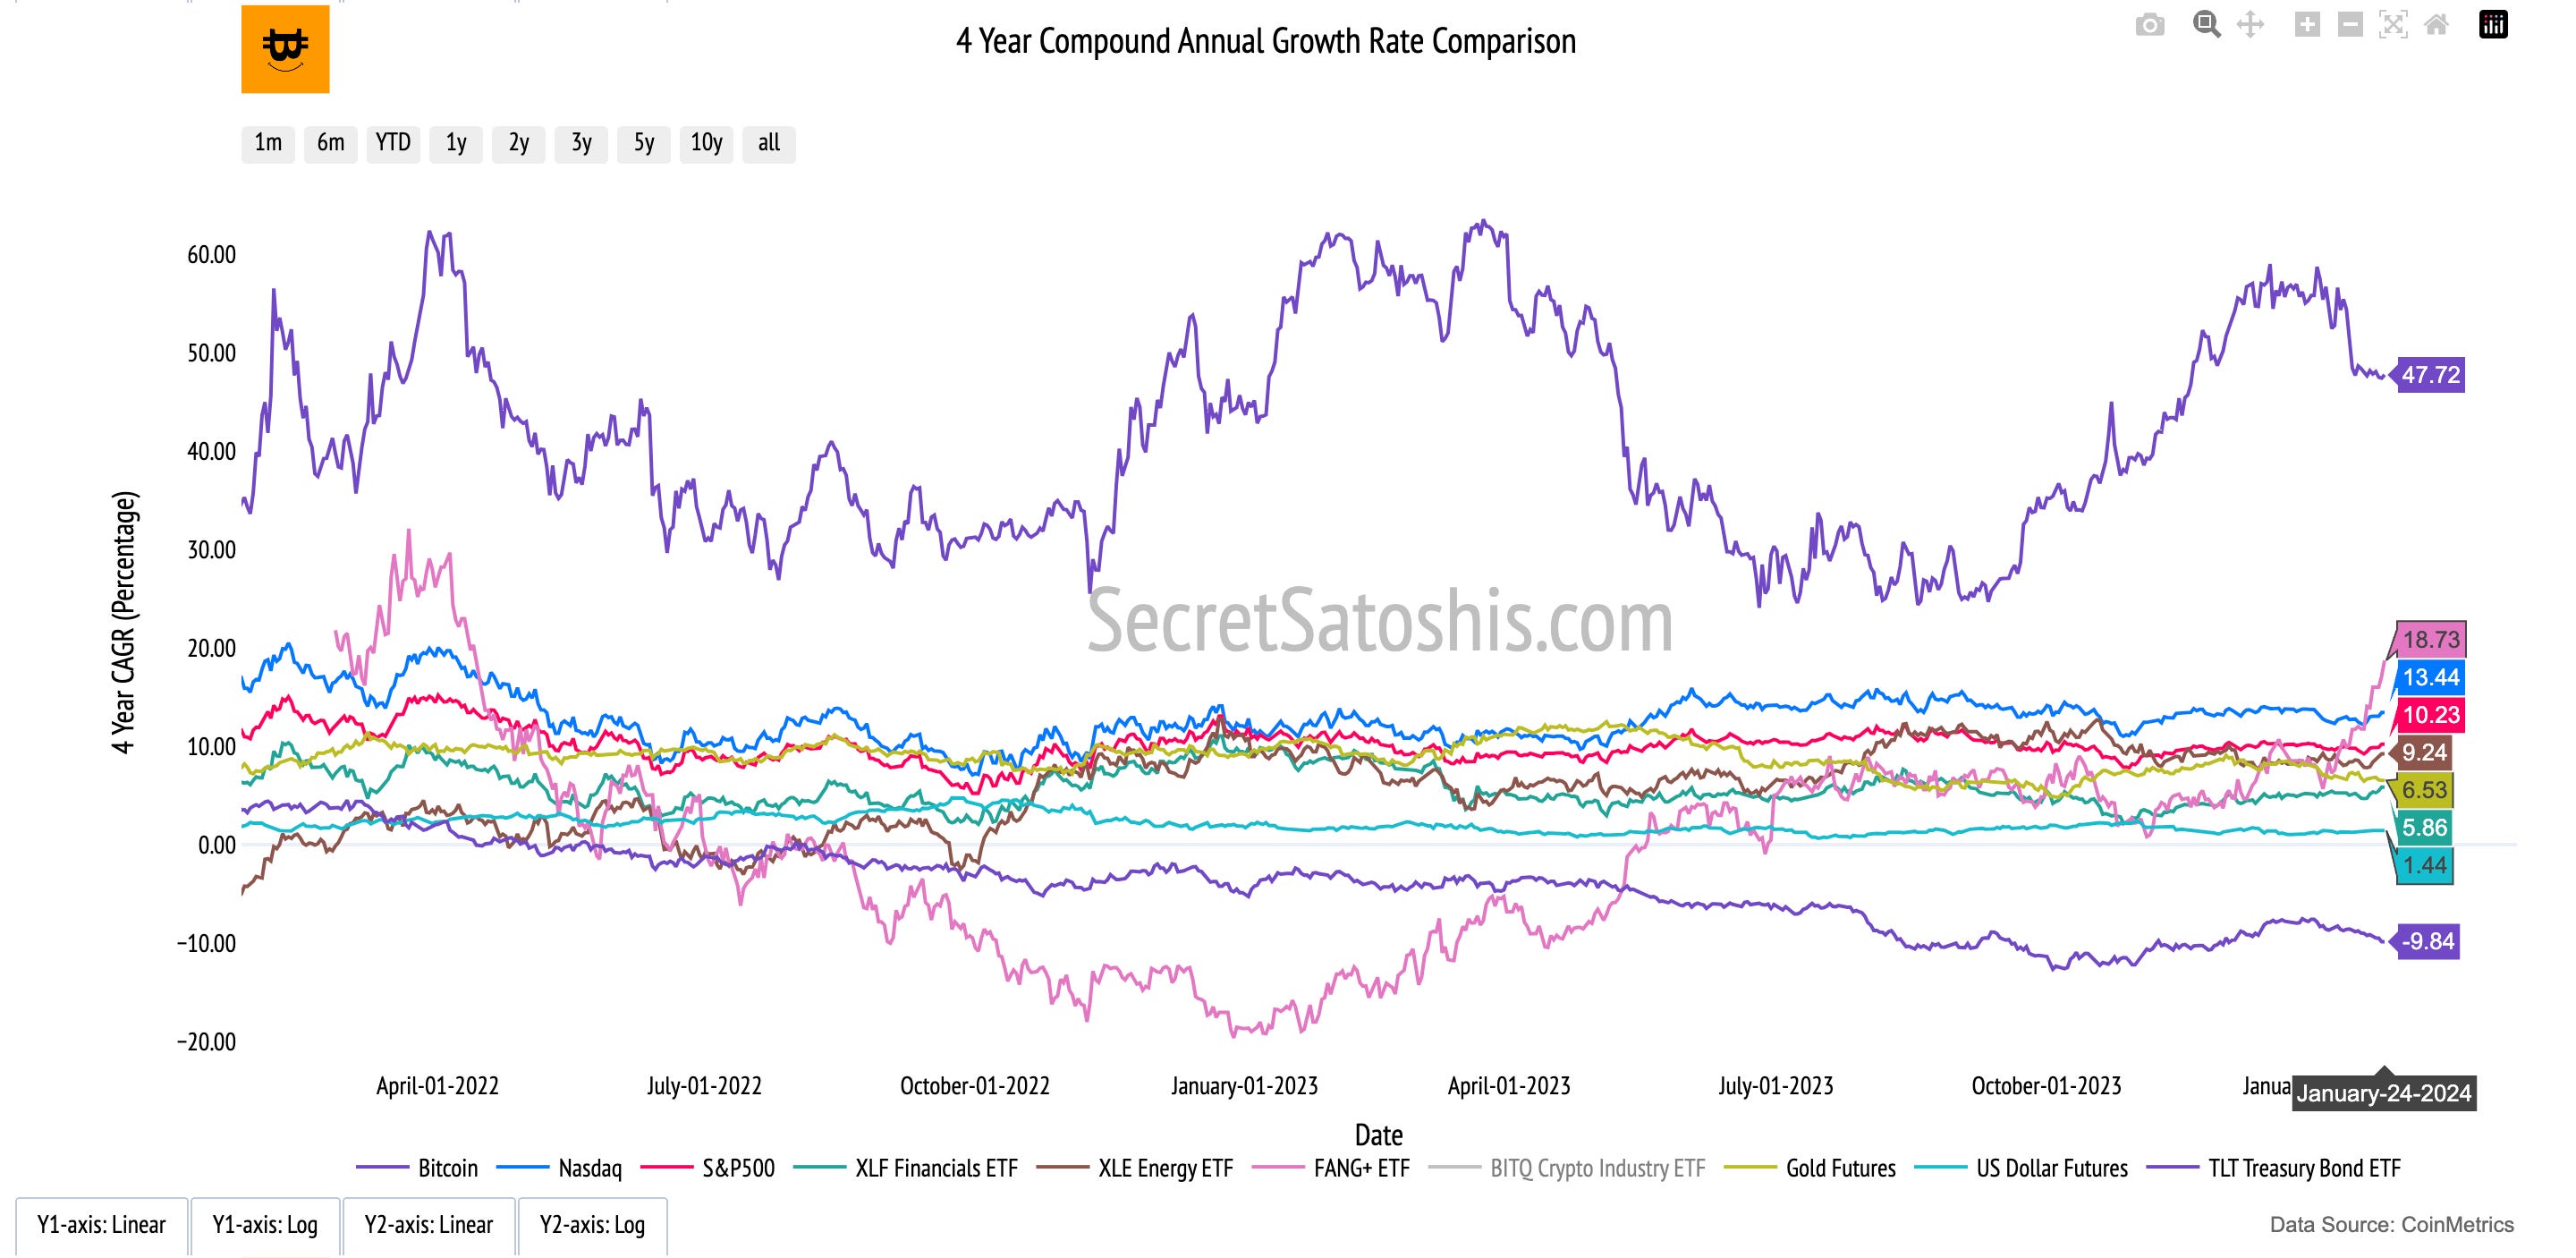
Examining the historical data, Bitcoin's year-to-date (YTD) return is recorded at -9.79%. To gain a comprehensive understanding, we must analyze the performance across various time frames and benchmark it against other asset classes.
Bitcoin's month-to-date (MTD) return aligns with its YTD return at -9.79%, signaling a challenging short-term period for the cryptocurrency. However, a shift in perspective to the 90-day return reveals a more favorable outcome, with Bitcoin achieving a 15.22% return. This disparity between the short-term MTD/YTD returns and the medium-term 90-day return suggests that despite recent adversities, Bitcoin has shown resilience and the potential for recovery over the quarter.
When we compare Bitcoin's YTD return to its historical 4-year Compound Annual Growth Rate (CAGR) of 47.38%, it becomes apparent that the current YTD performance falls short of its historical growth trajectory. This may point to a temporary downturn or a consolidation phase within an overarching bullish trend.
In comparison to other assets, Bitcoin's 4-year CAGR significantly surpasses them, with the FANG+ ETF being the next best performer at a 4-year CAGR of 17.12%.
In summary, while Bitcoin's recent performance may appear lackluster, its medium to long-term returns, along with its historical growth trend, make a strong argument for its inclusion in a diversified investment portfolio. Investors should weigh these metrics against their investment horizon and risk appetite to make well-informed decisions.
On-Chain Transaction Activity
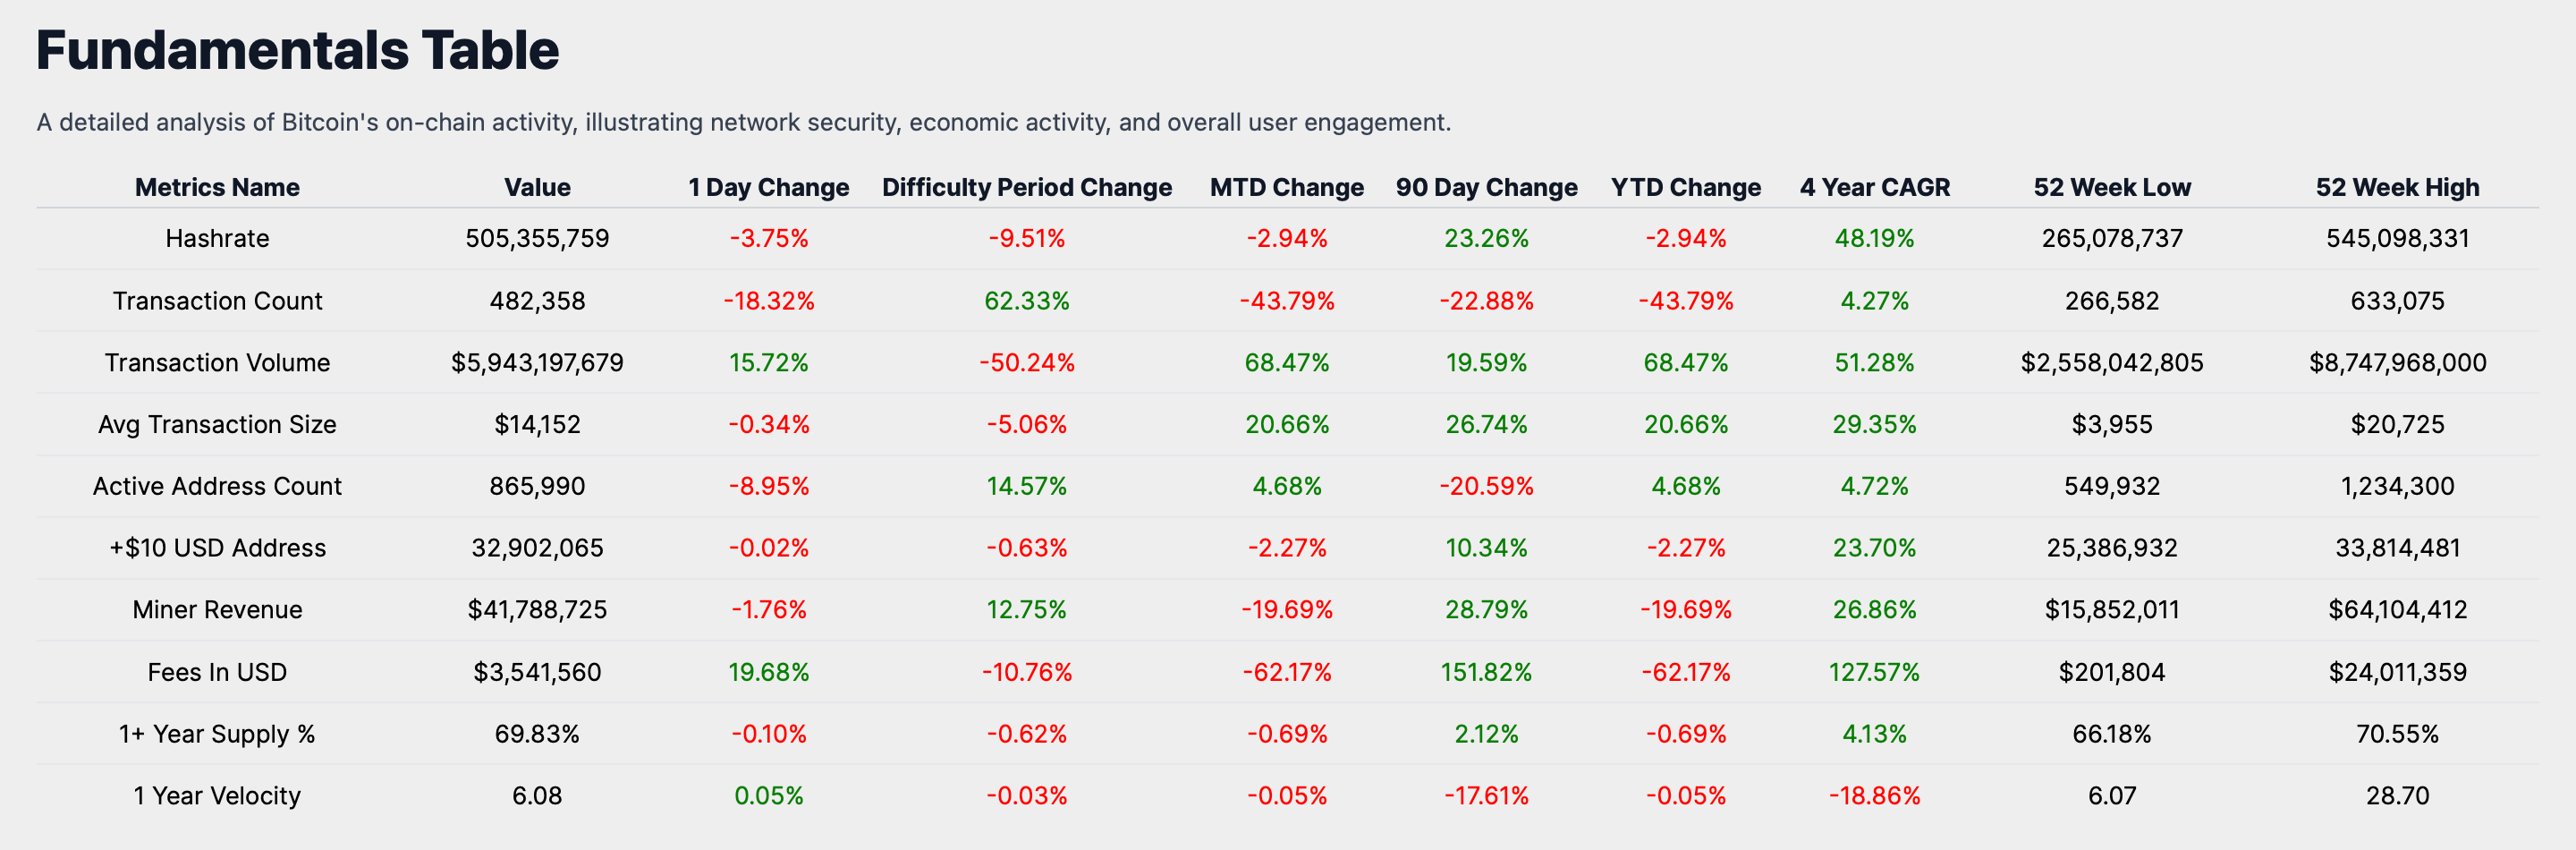
In the recent difficulty period, the Bitcoin network has exhibited a slowdown in activity. The transaction count has decreased to 482,358, indicating a reduction in network transactions. Concurrently, the transaction volume has reached $5,943,197,679 USD, revealing a high volume of capital movement despite the fewer transactions.
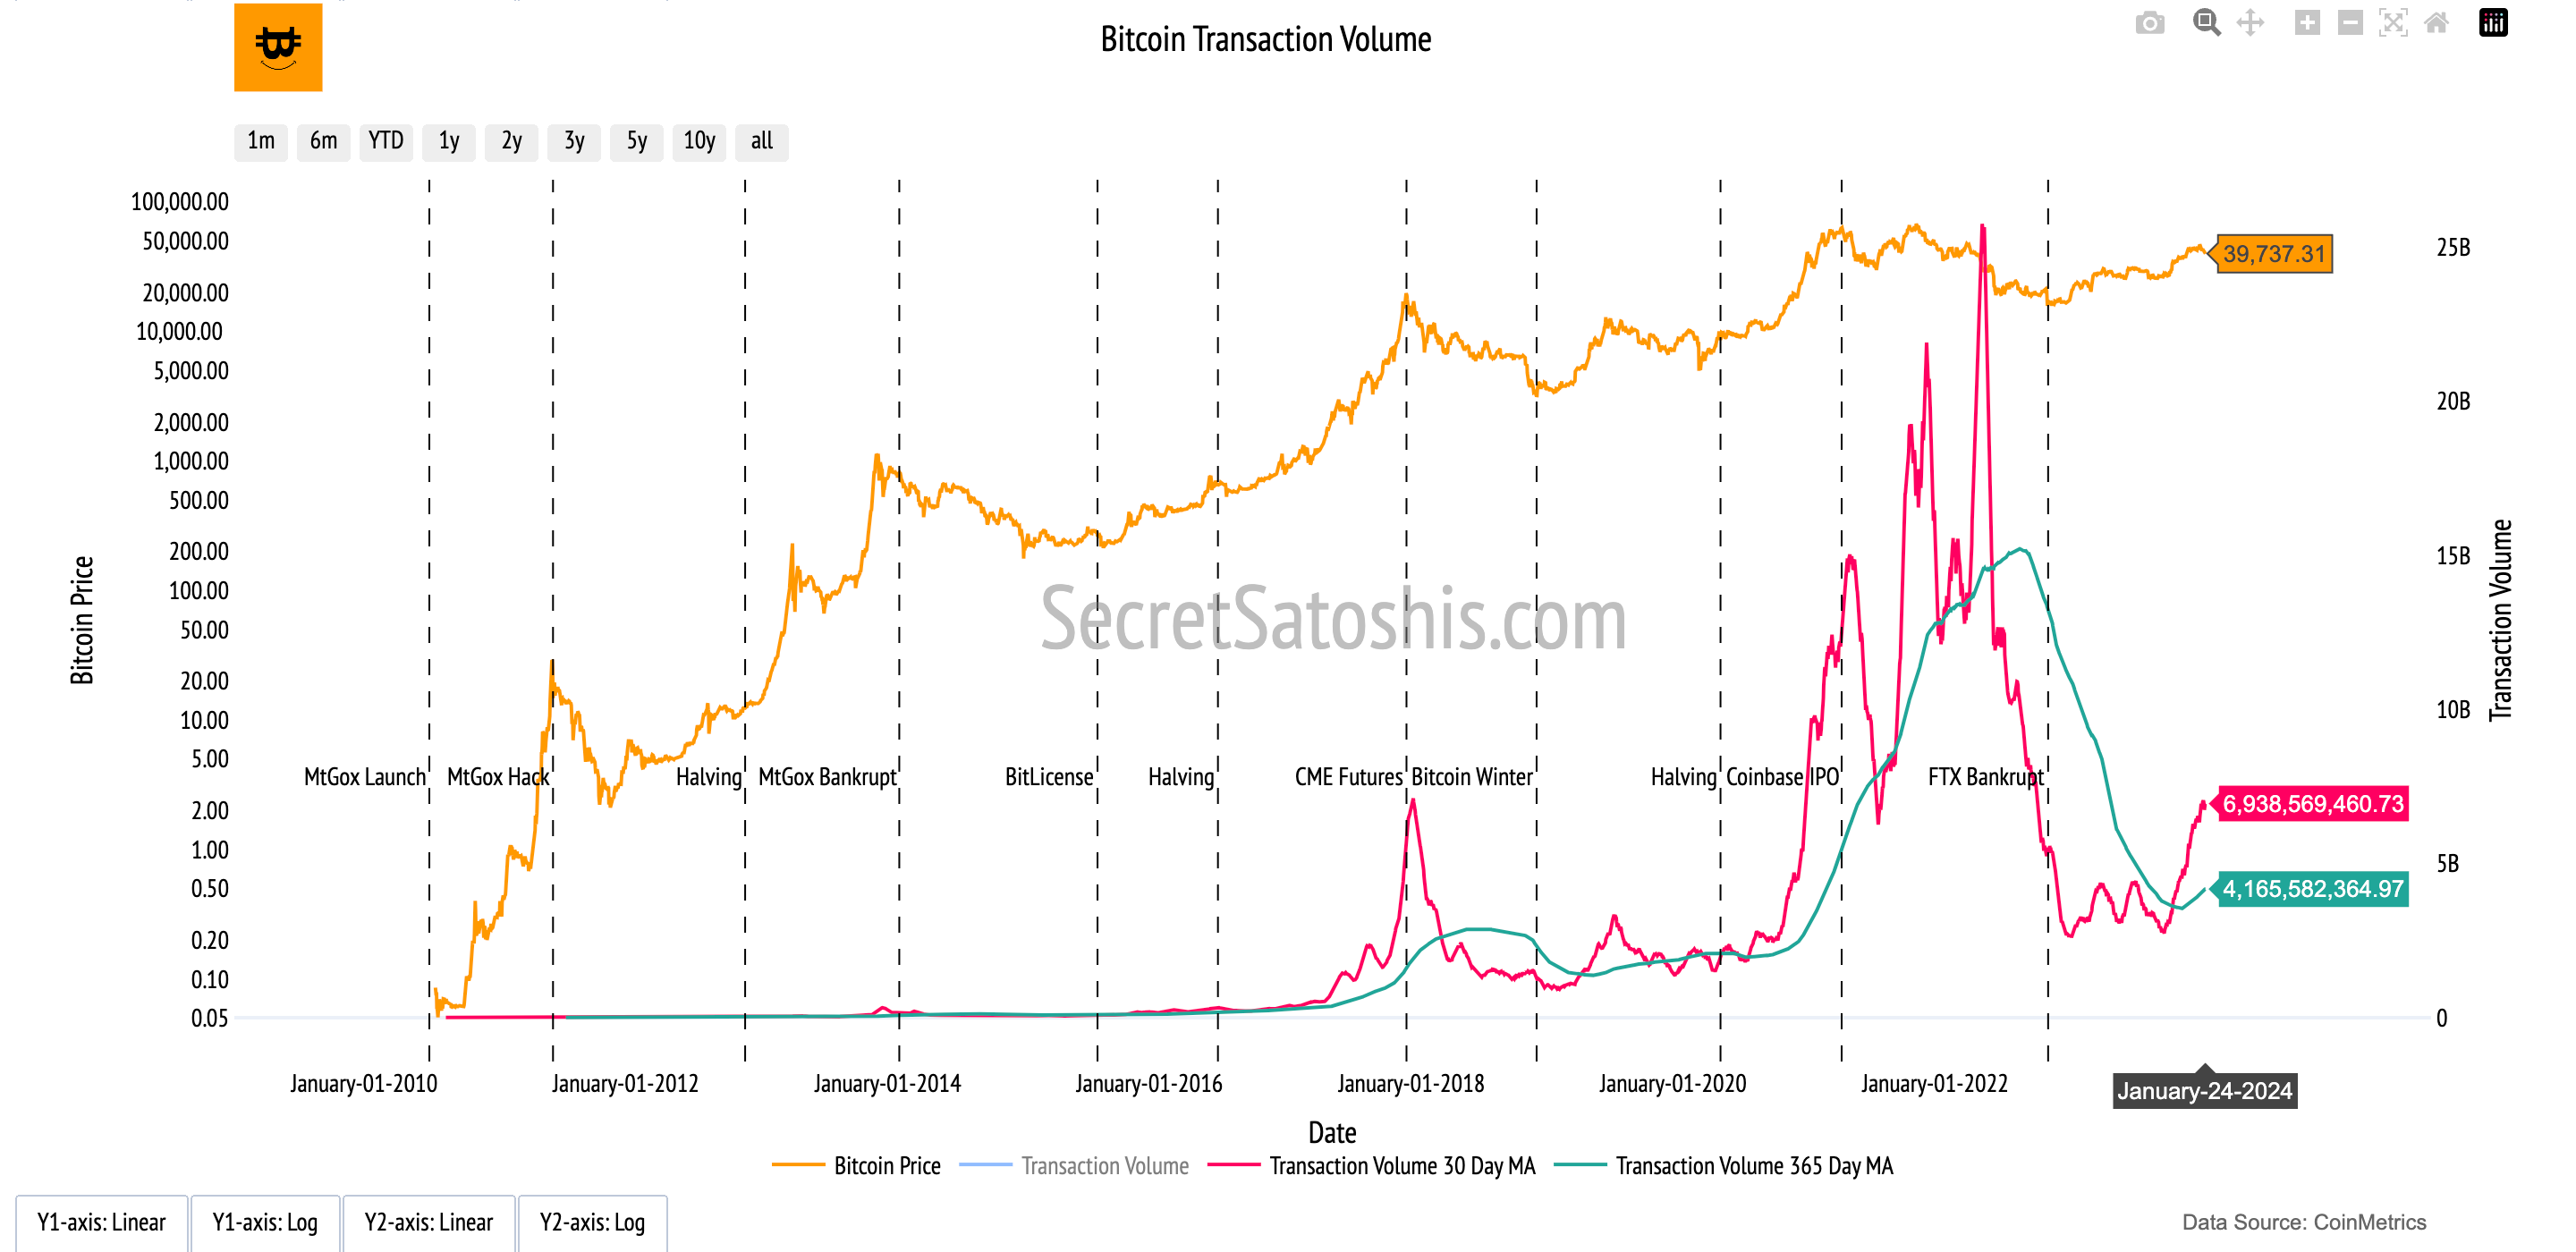
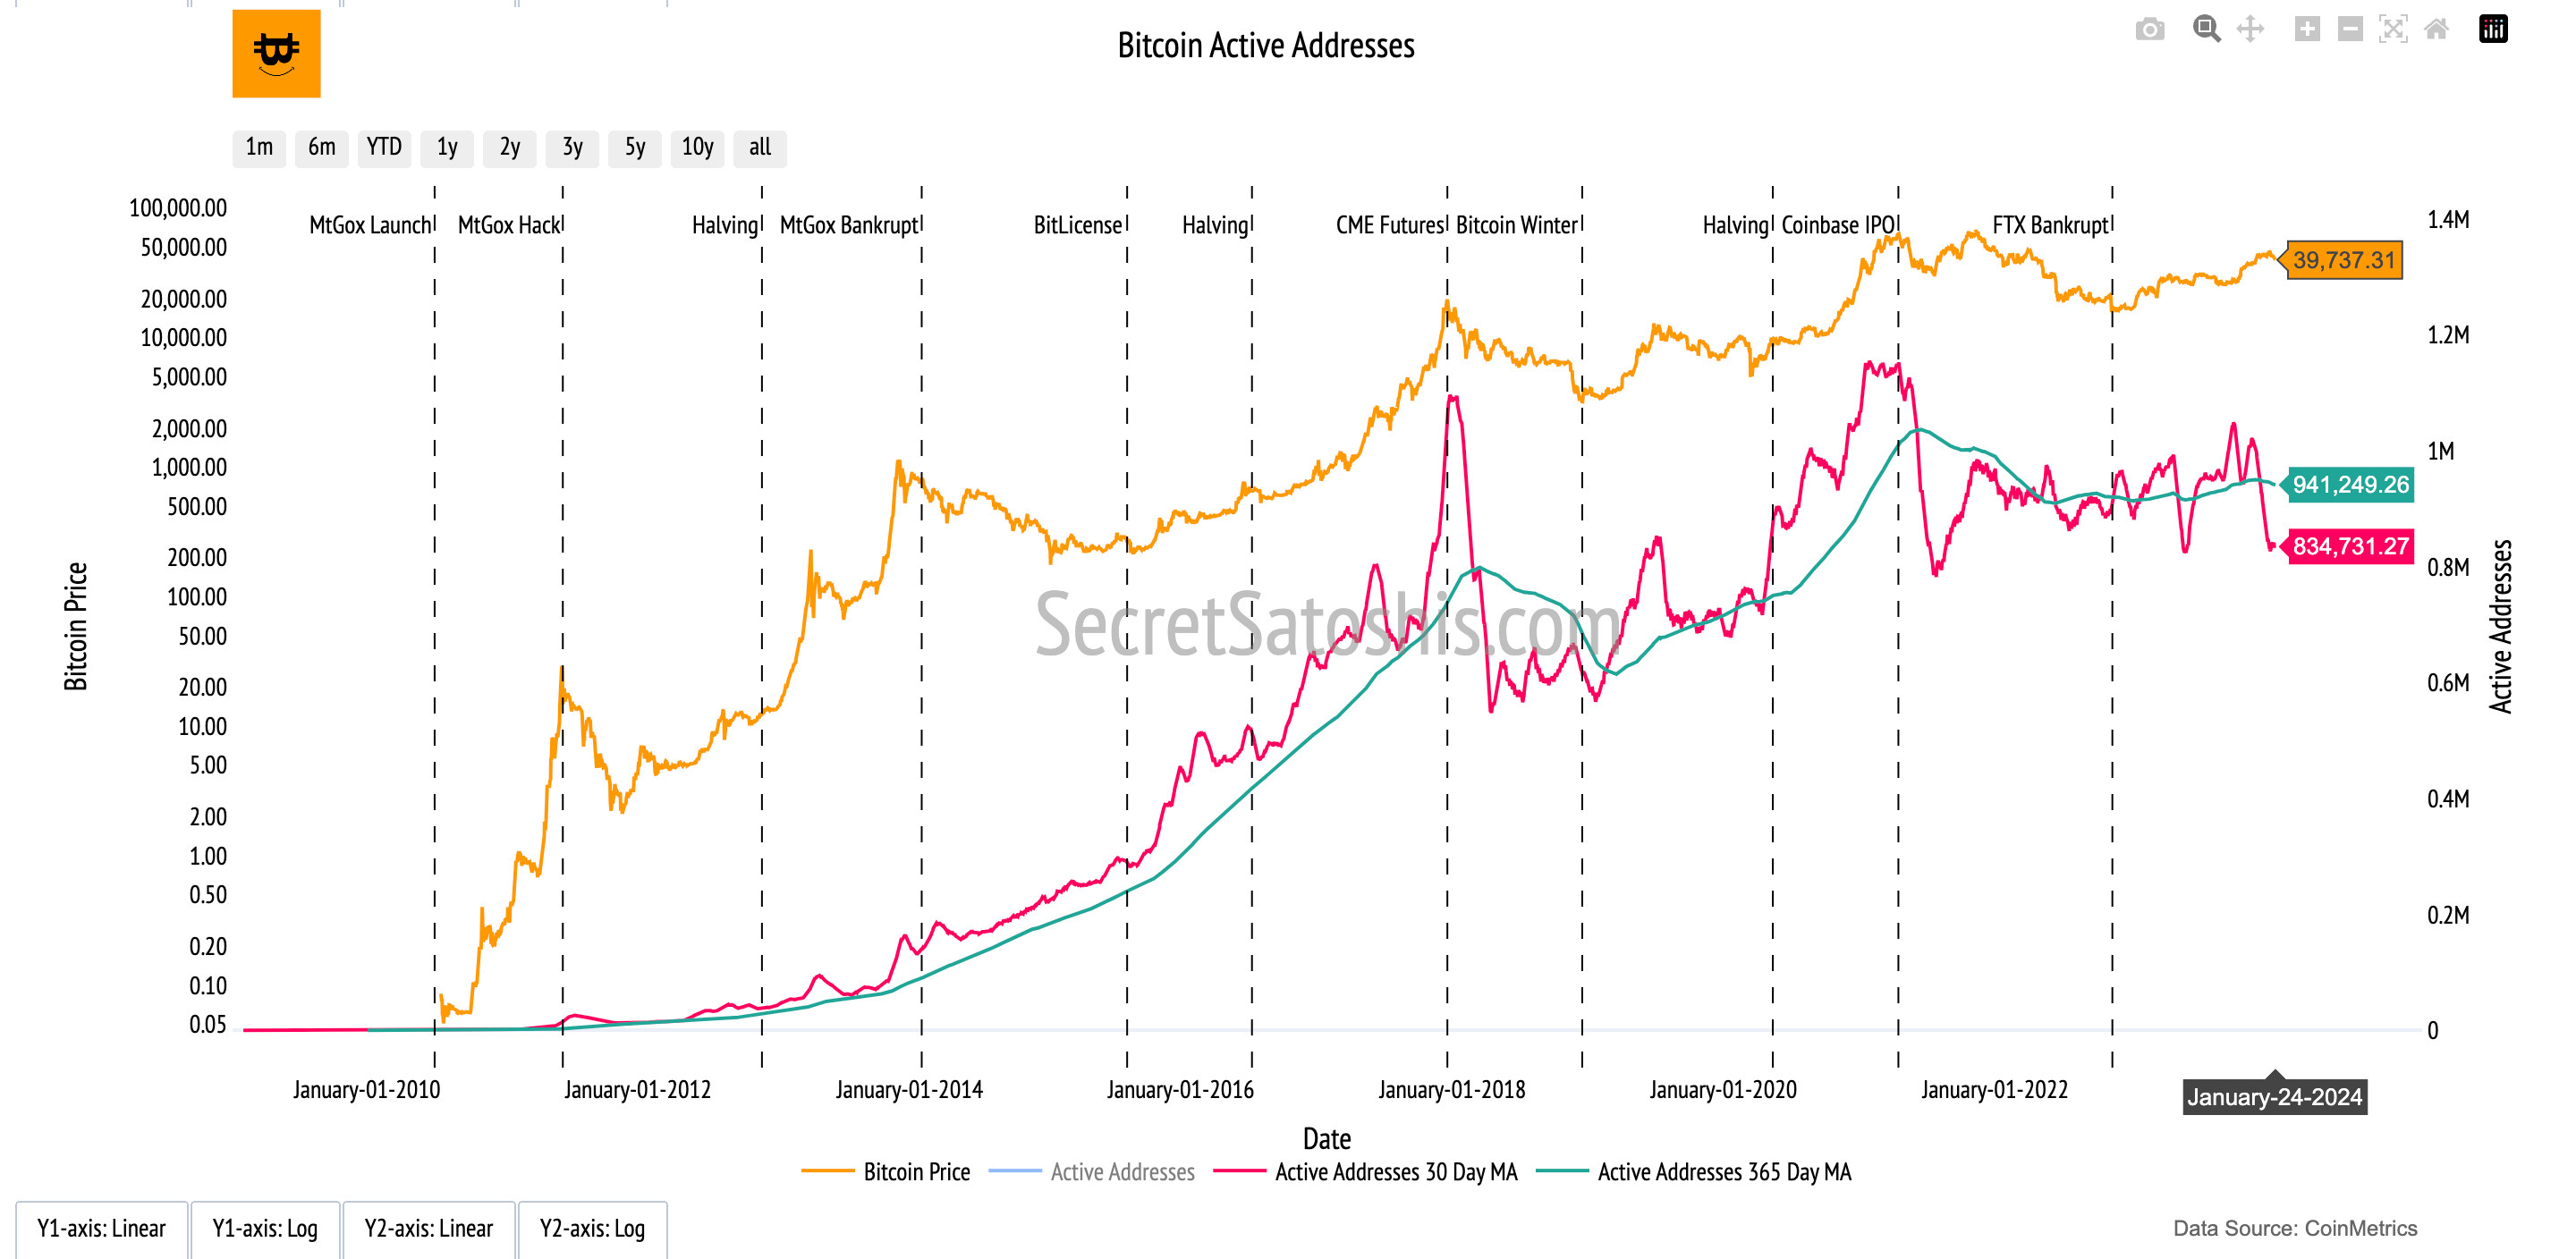
The average transaction size is currently $14,152 USD, which suggests that individual transactions are slightly smaller on average. The network also has 865,990 active addresses, pointing to a slight decline in the active Bitcoin ecosystem.
The performance of these transaction metrics during the difficulty period points to a nuanced economic activity on the Bitcoin network. While the transaction count has seen a notable decrease, the increase in transaction volume implies that the network is still facilitating significant capital transfers, possibly reflecting larger institutional or consolidated individual transactions.
Miner Economics
The transaction activity on the Bitcoin network has led to moderate miner revenues. The current miner revenue stands at $41,788,725 USD, presenting a challenging economic landscape for miners. Fees generated amount to $3,541,560 USD, constituting approximately 8.48% of the miner's revenue. This percentage indicates a fee market that, while under some strain, remains a critical component of the network's economic incentives, ensuring the security and functionality of the Bitcoin network.
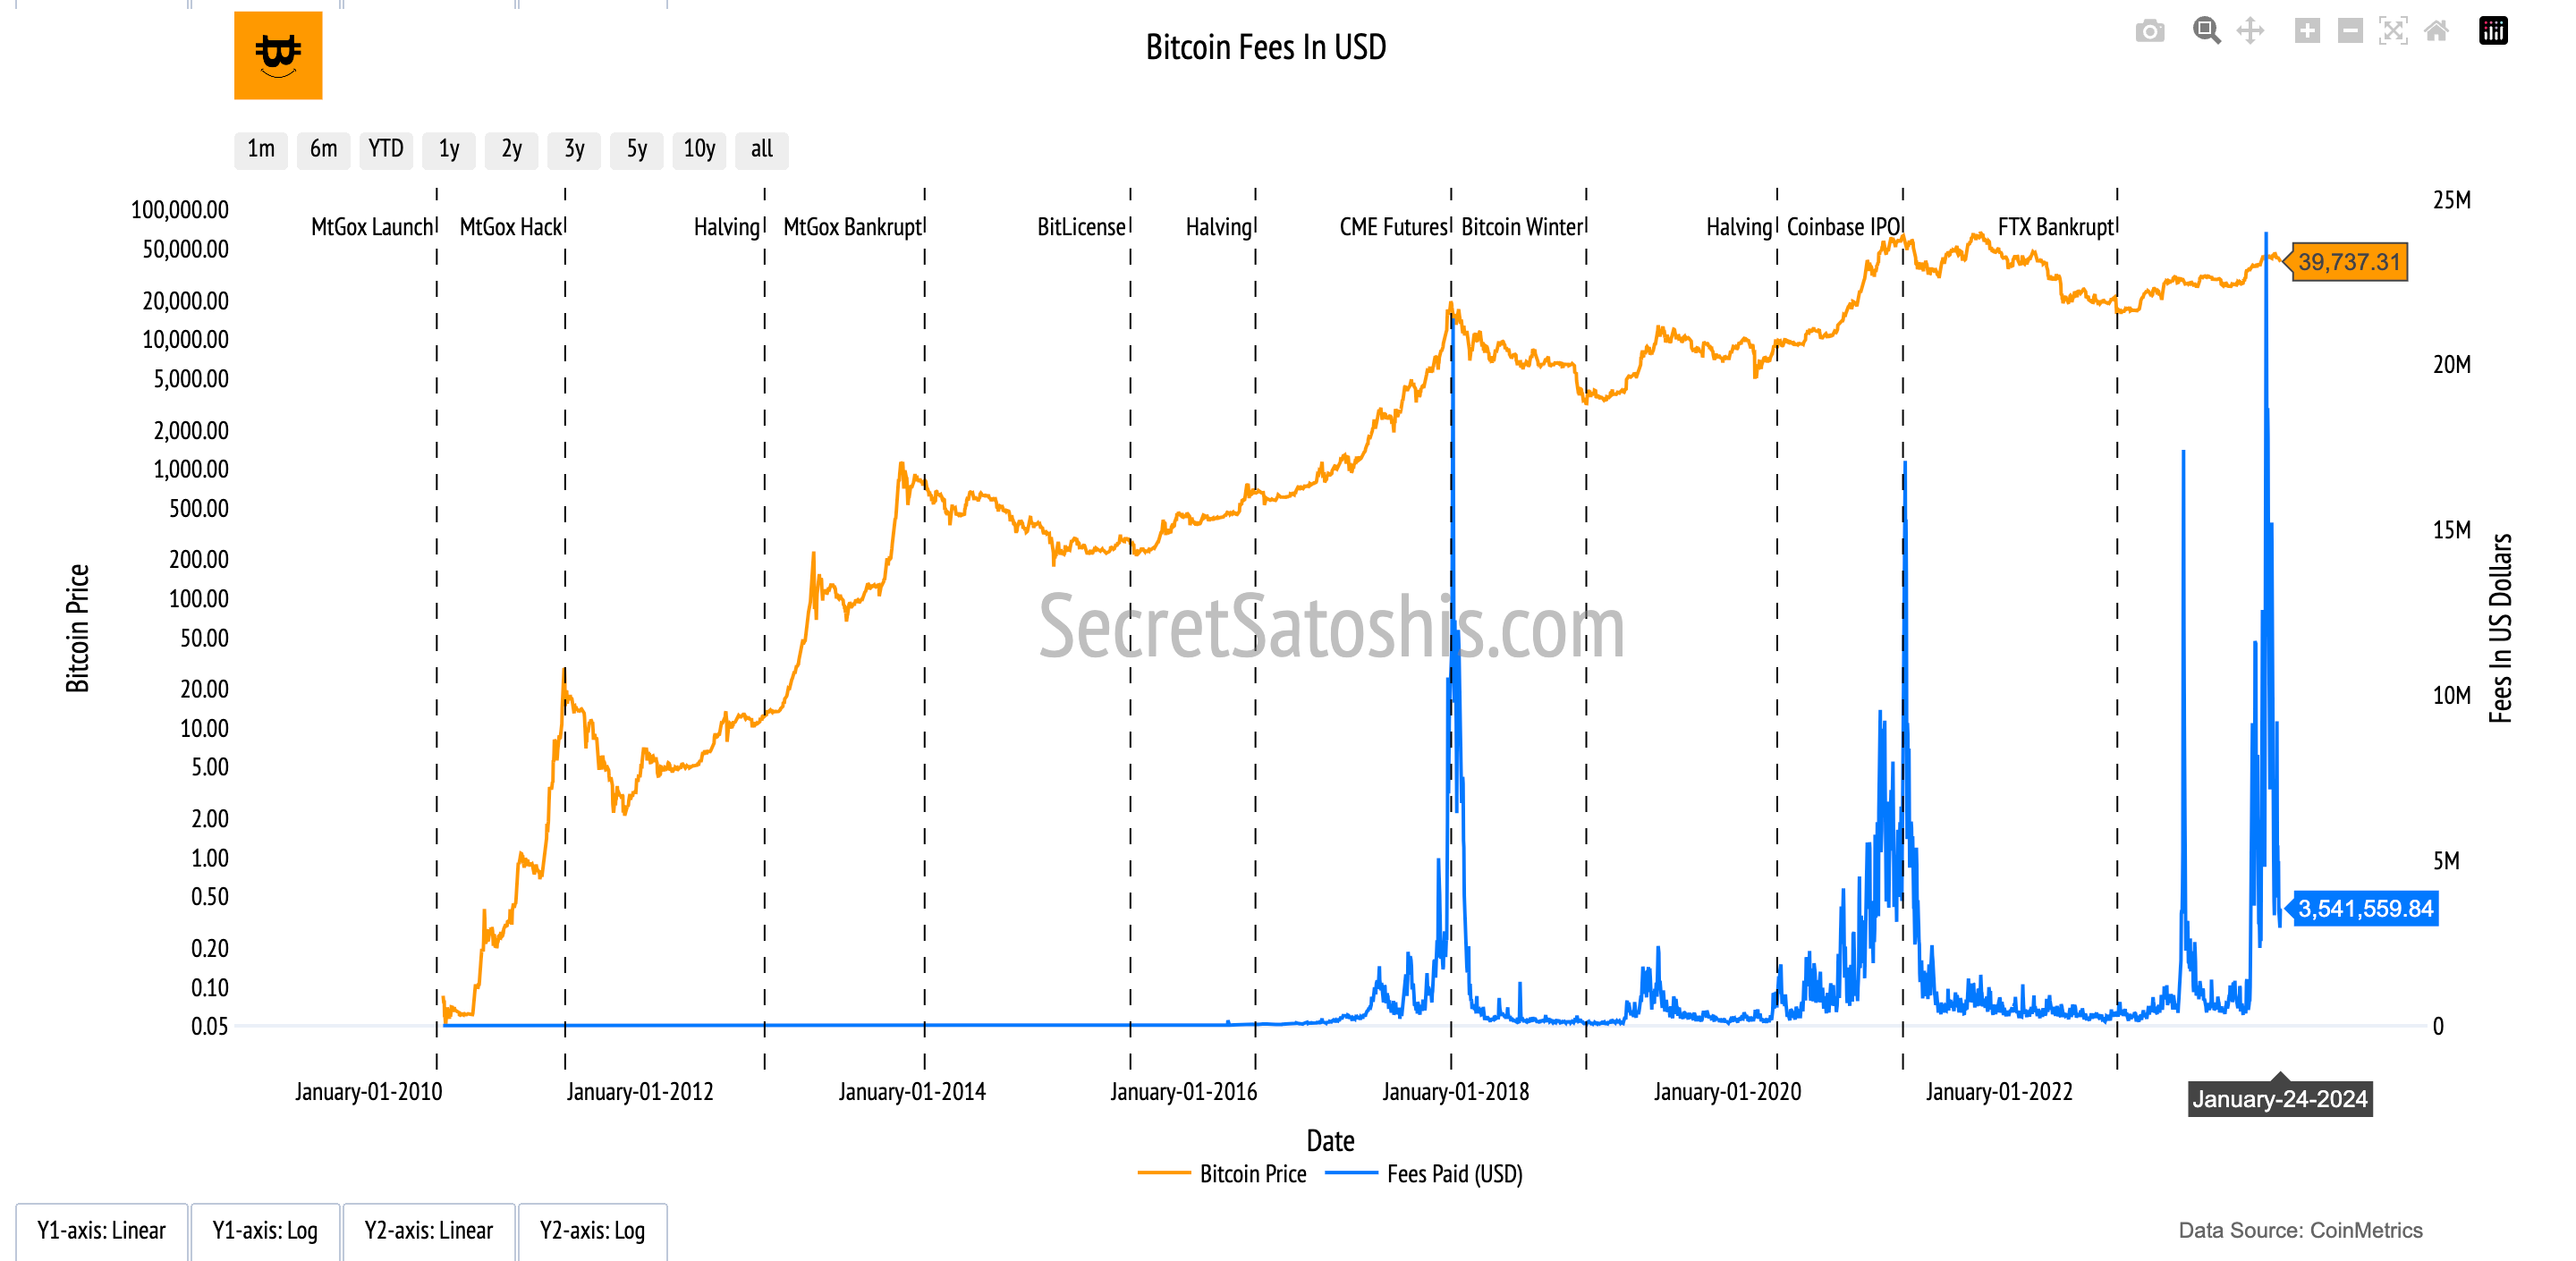
The fee in USD reflects the network's ability to sustain its security model through transaction fees, despite a decrease in miner revenue. This suggests that the network's fee market is adapting to the current economic conditions, maintaining its role in supporting network security.
Bitcoin Holder Behavior
The Bitcoin network currently has 32,902,065 addresses with balances greater than 10 USD, signifying a robust number of users with investments in the network. Additionally, 69.83% of the Bitcoin supply has not moved for over a year, indicating a strong holder base with a long-term investment perspective. The 1-year velocity stands at 6.08, suggesting that the majority of Bitcoin is being held rather than traded, which reinforces the perception of Bitcoin as a dependable store of value.
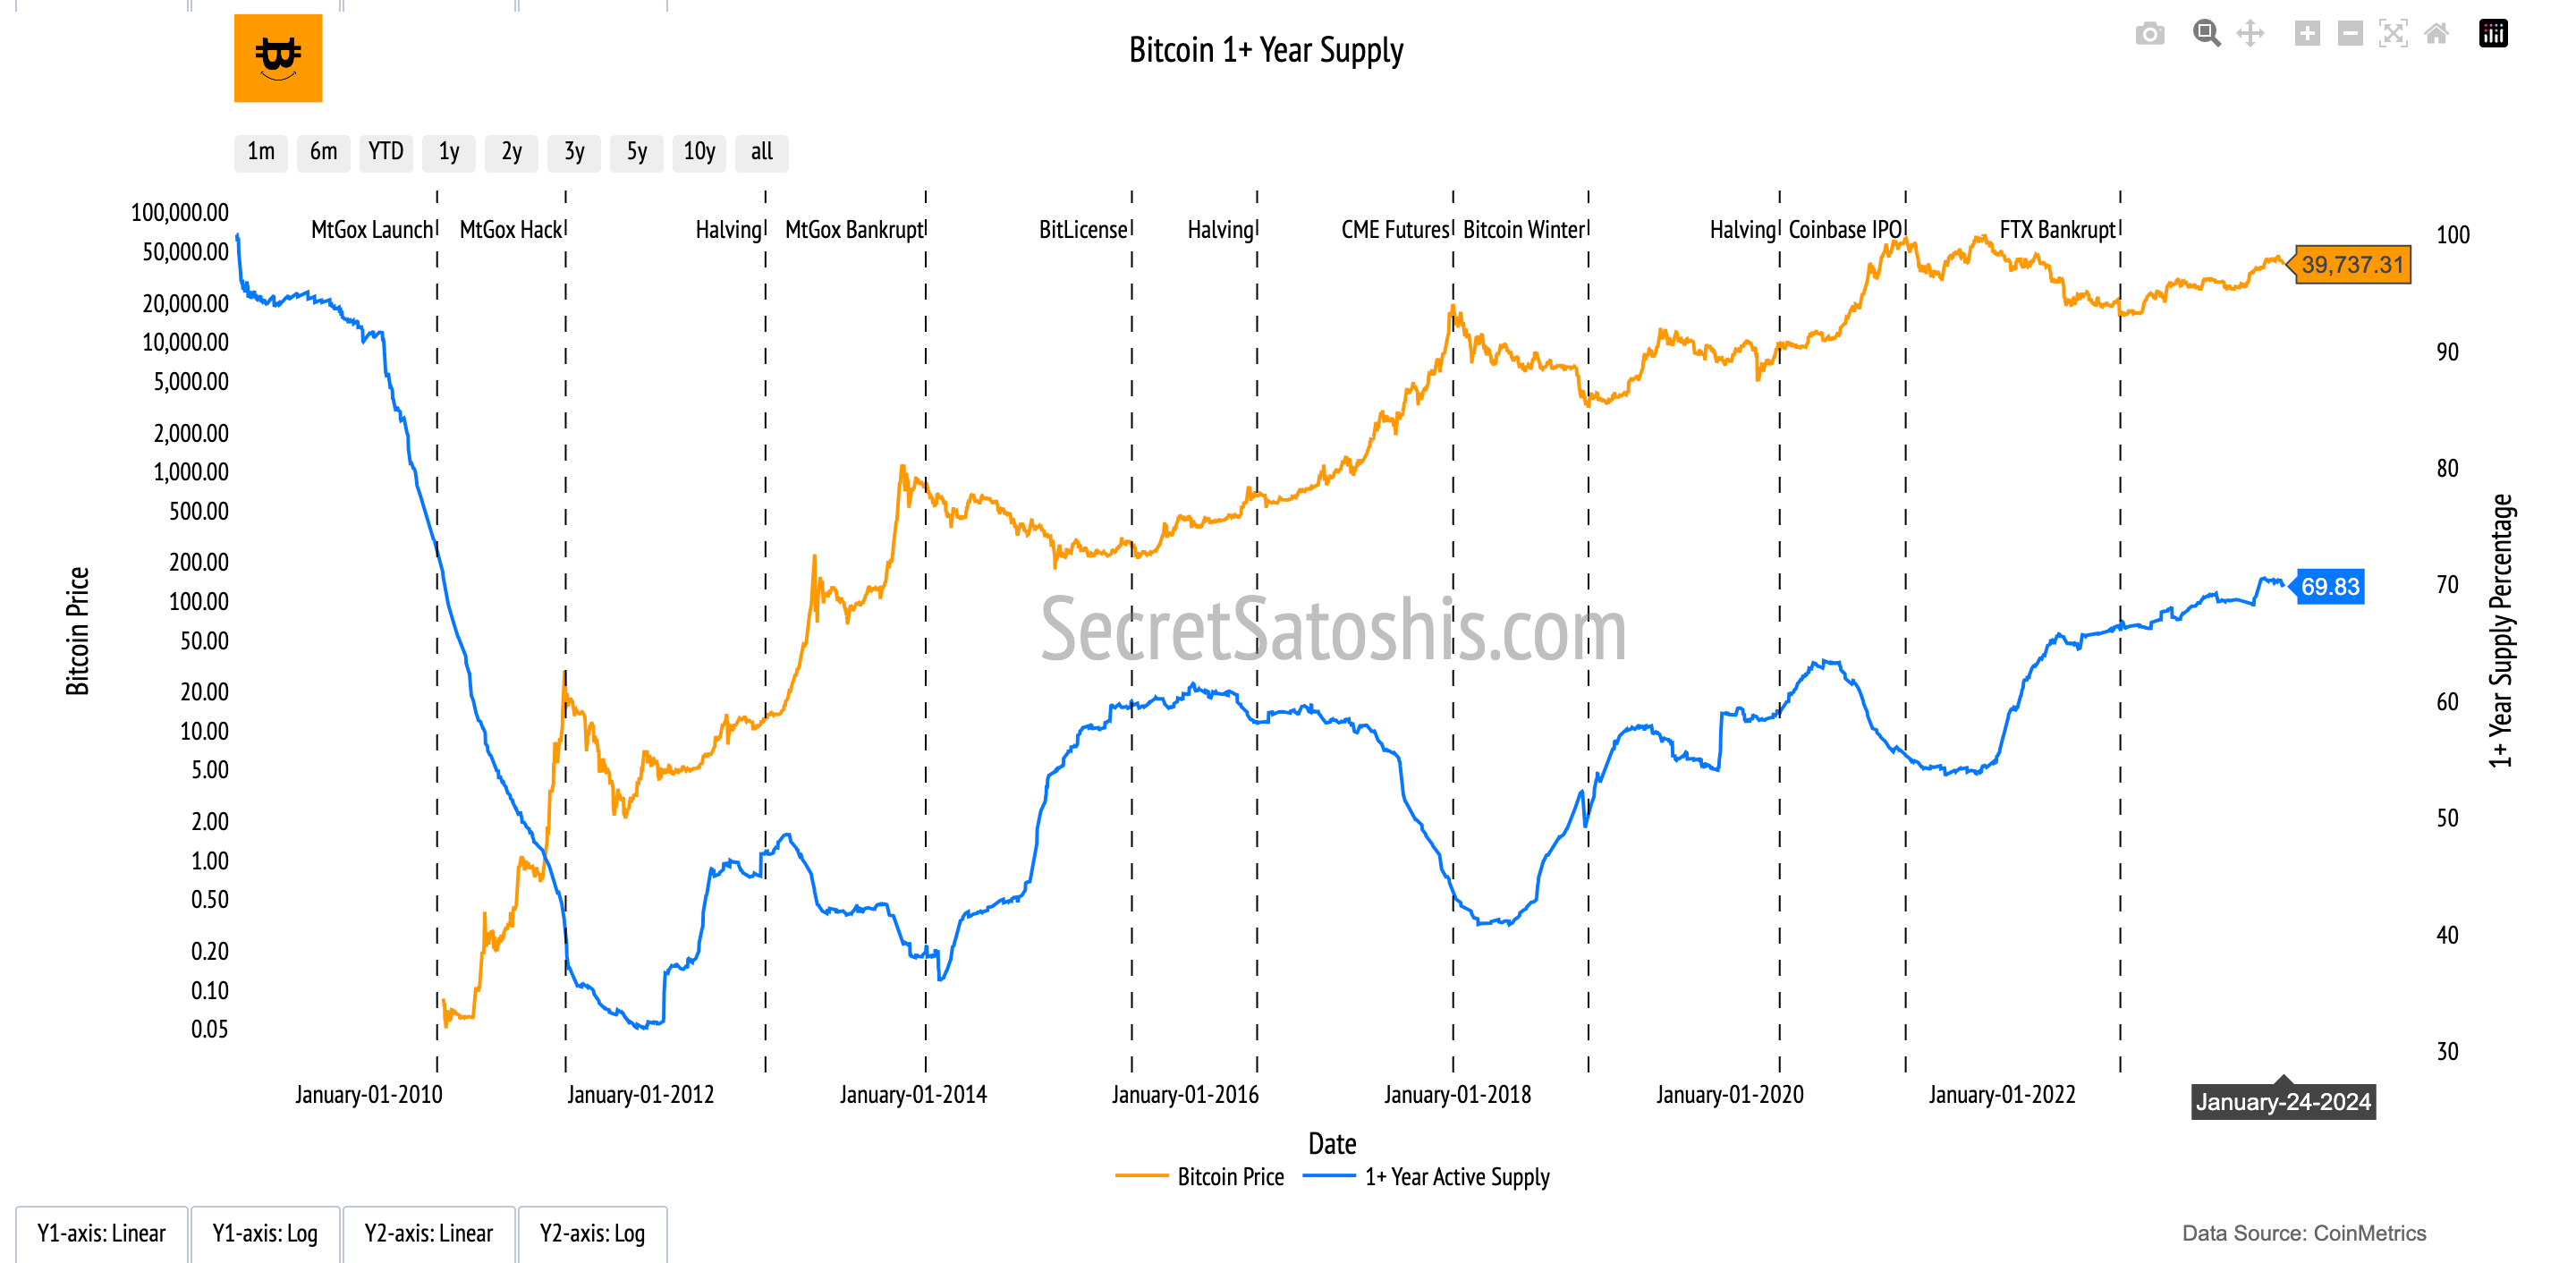
The slight decrease in the number of +$10 USD addresses during the difficulty period and YTD suggests a marginal dip in the growth of new investors or the consolidation of smaller balances. However, the high percentage of 1+ year supply indicates that the long-term investment sentiment among Bitcoin holders remains strong, with many investors continuing to view Bitcoin as a valuable long-term asset.
Bitcoin Valuation Analysis
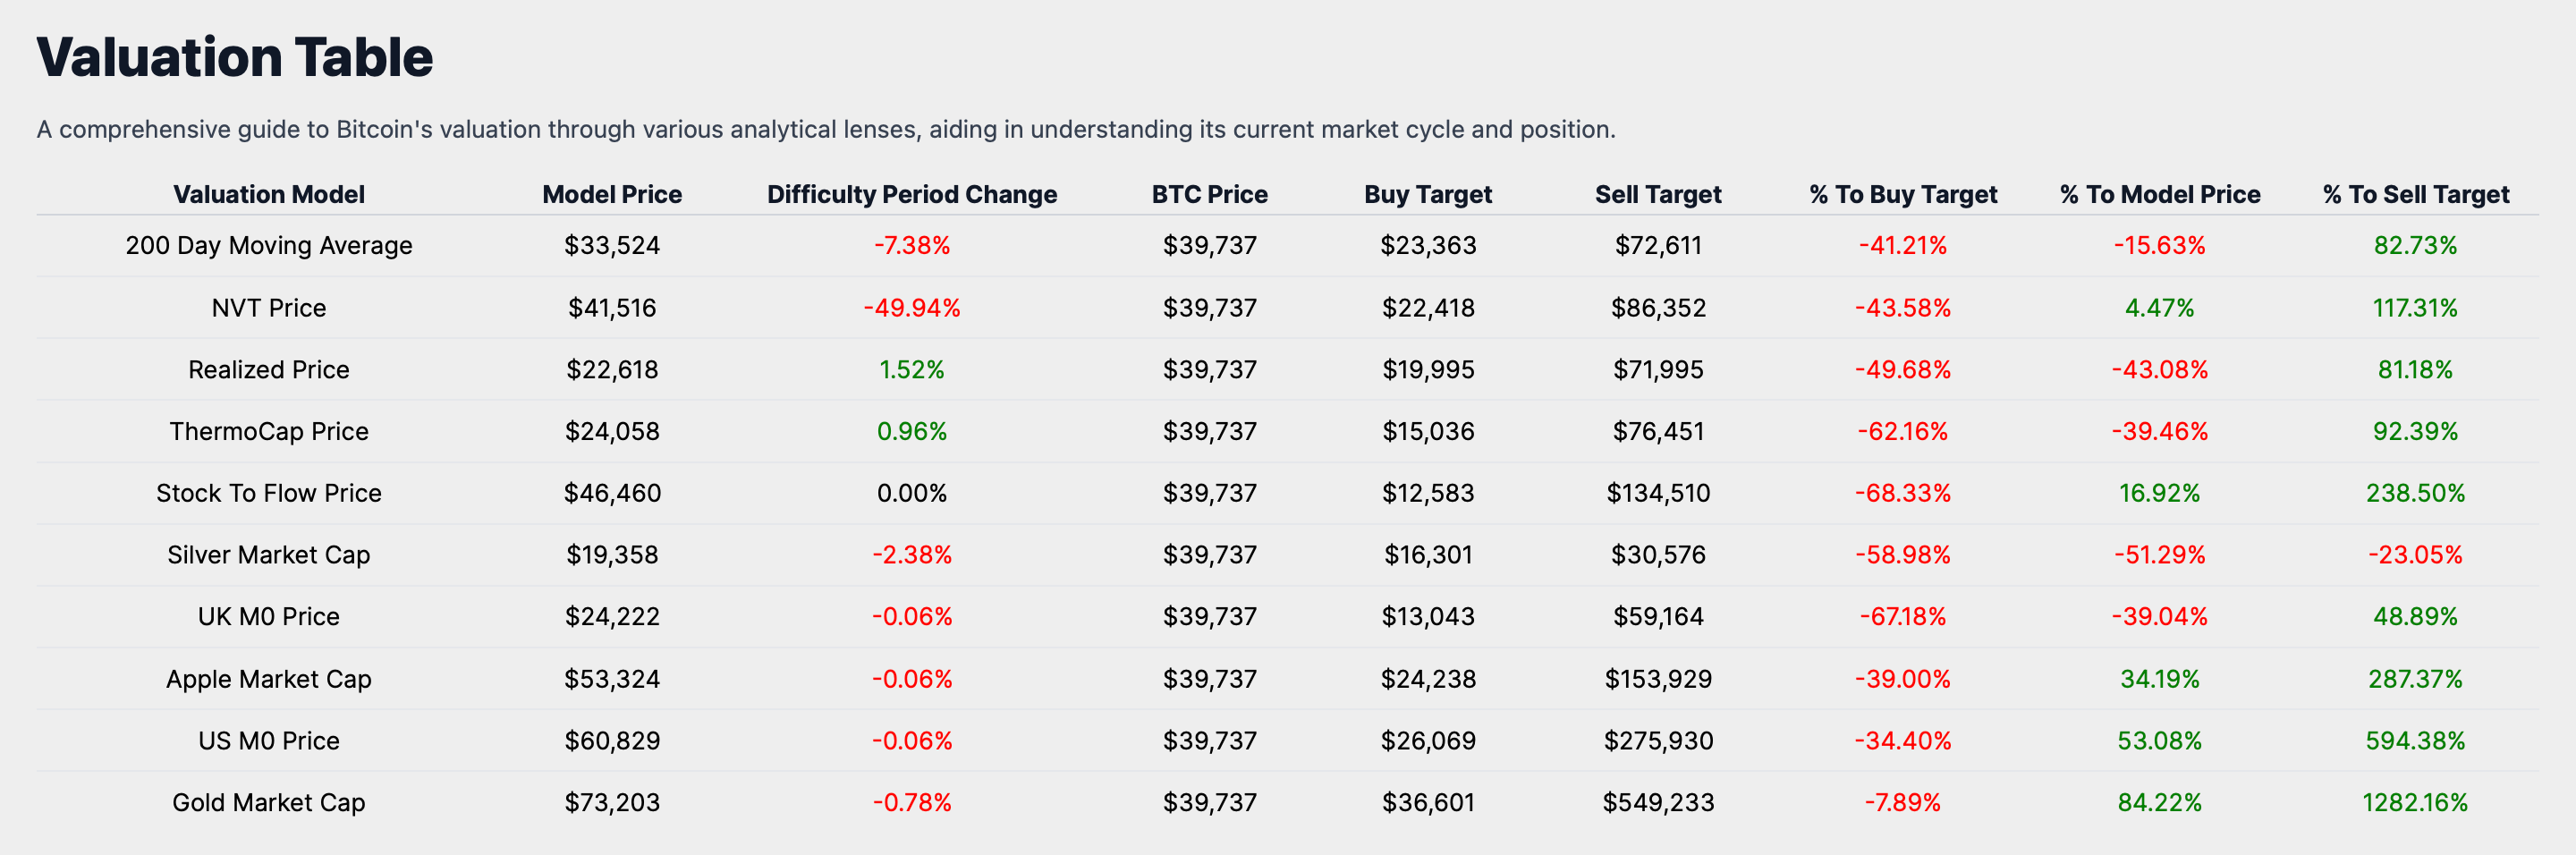
In this segment, we will analyze Bitcoin's current market price of $39,737. We will scrutinize this figure through various analytical lenses, offering investors a comprehensive view of Bitcoin's market standing.
Technical Price Models
Our first lens, the Technical Price Model, is based on the 200-Day Moving Average, a trusted metric in the financial world. This model calculates the average of Bitcoin's closing prices over the past 200 days. As of now, the model price based on this average stands at $33,524, which is approximately 15.63% lower than the current BTC price. Such deviations from this average often give us clues about market trends, offering insights into Bitcoin's long-term price trajectory.
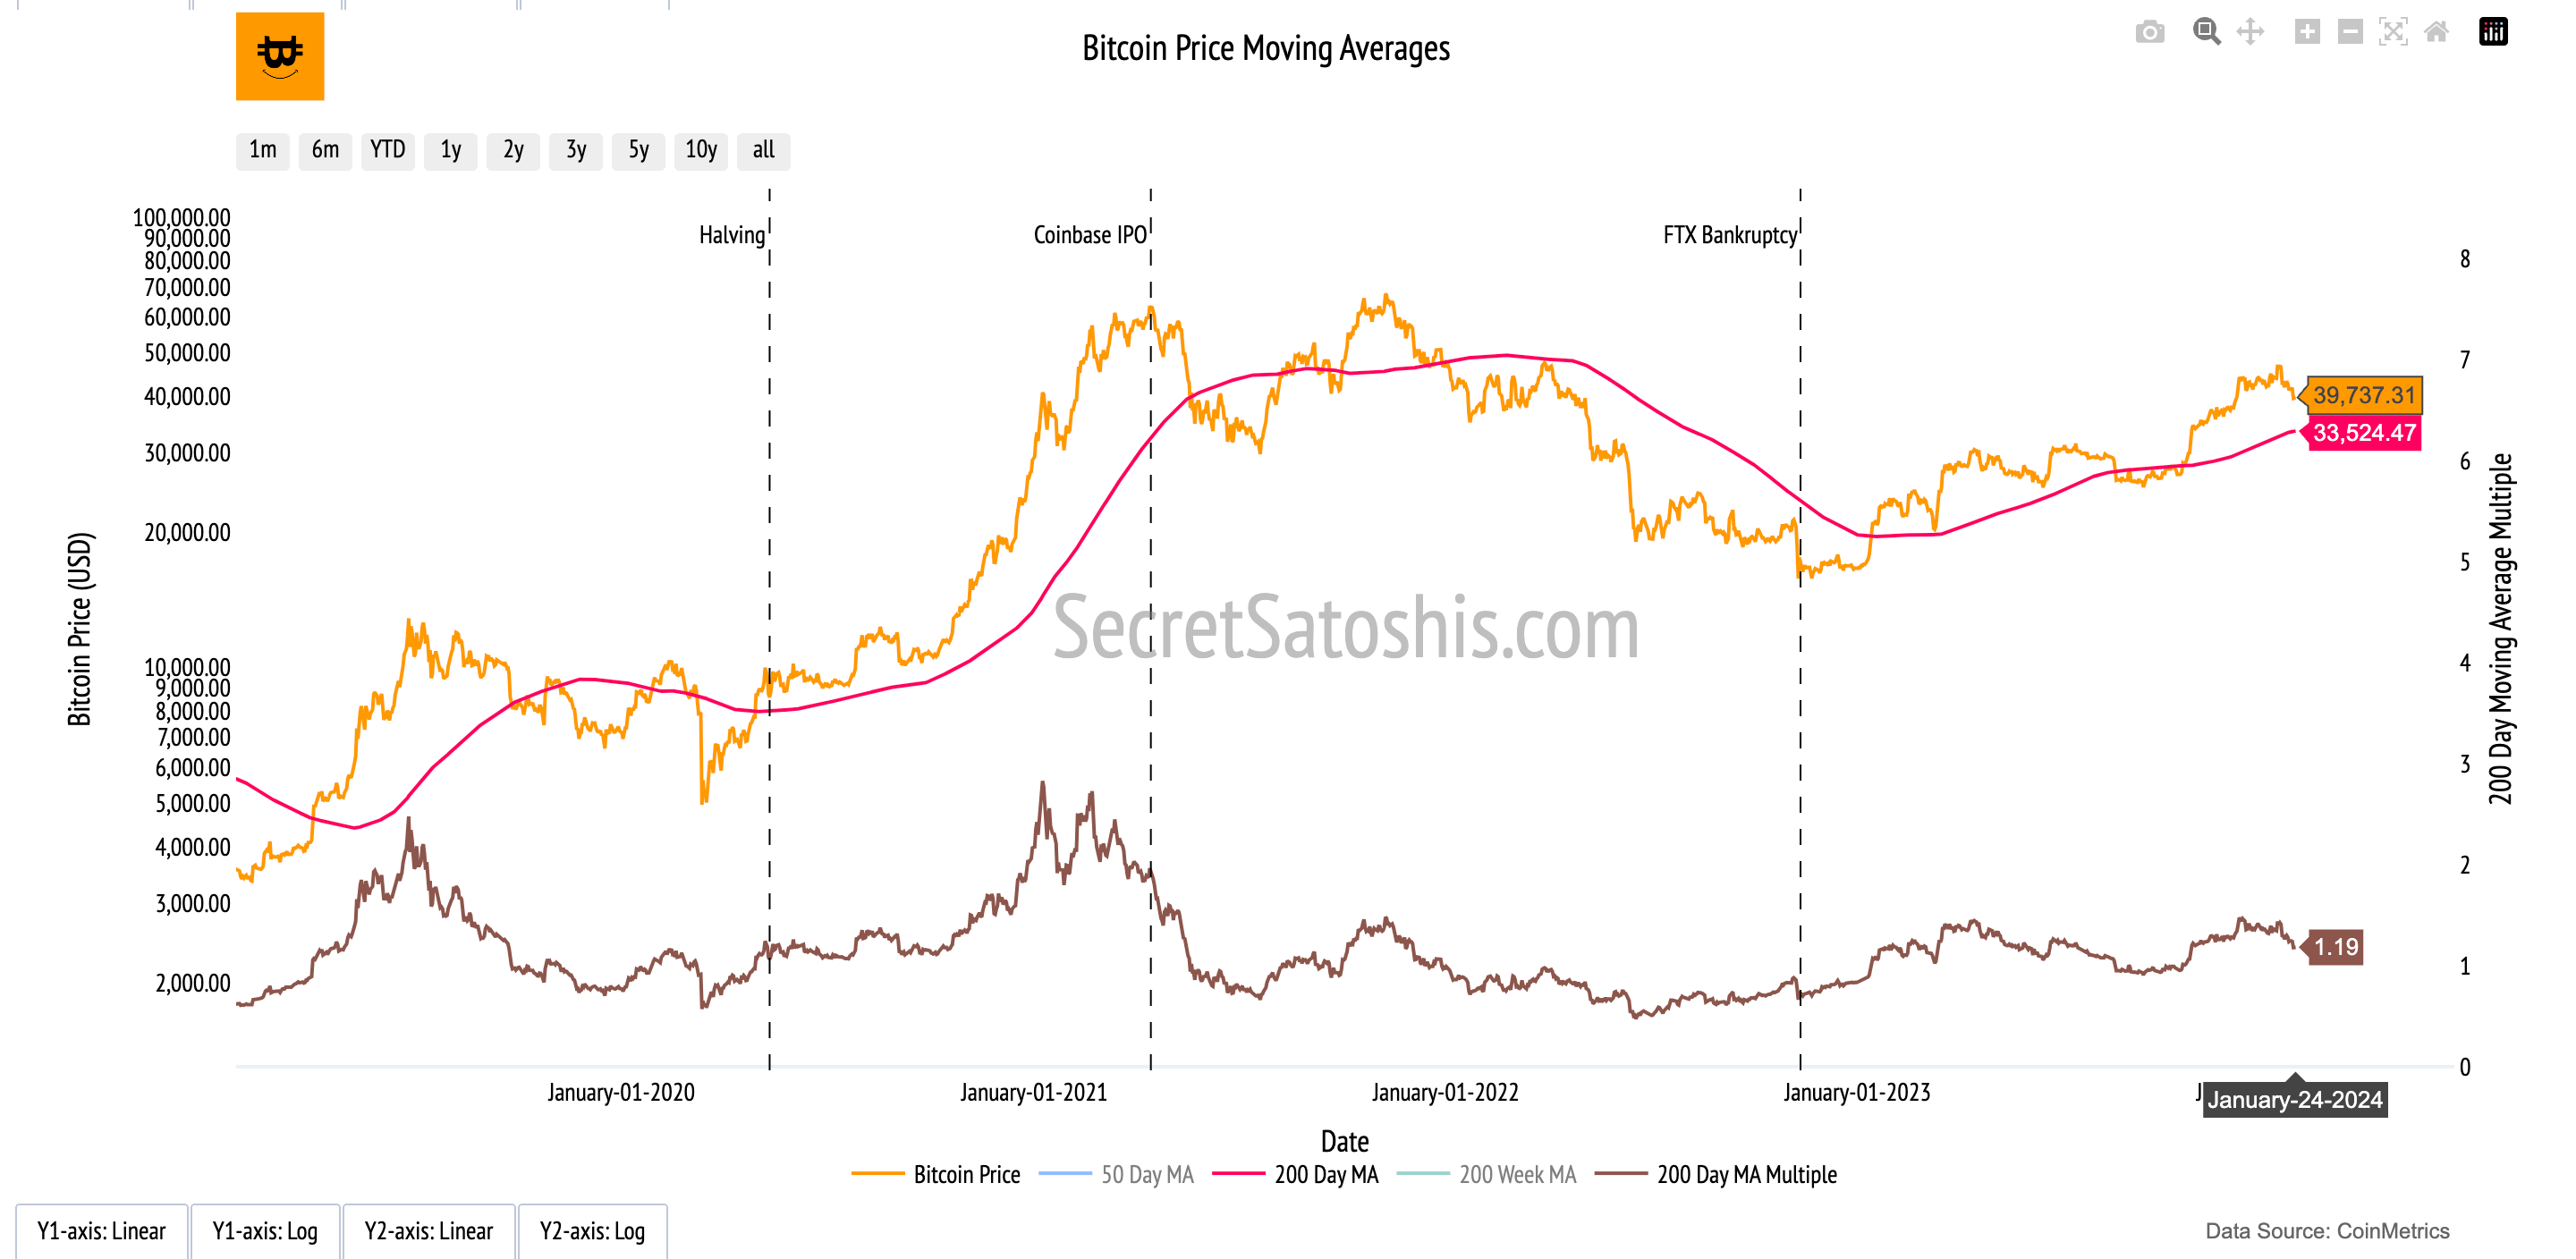
For those looking for entry and exit points, the buy target is set at 0.7 times the 200-day moving average price, pegging it at $23,363. This means we are currently 41.21% above this buy target. On the other hand, the sell target is 2.2 times the 200-day moving average price, translating to $72,610, which is 82.73% above our current BTC price.
On-Chain Valuation Models
As we examine the on-chain valuation models, we gain invaluable insights into Bitcoin's intrinsic value through its blockchain data. These models provide a window into transactional demand, on-chain cost basis, and network revenue, which are pivotal in understanding Bitcoin's true worth.
NVT Price Model: Transactional Demand
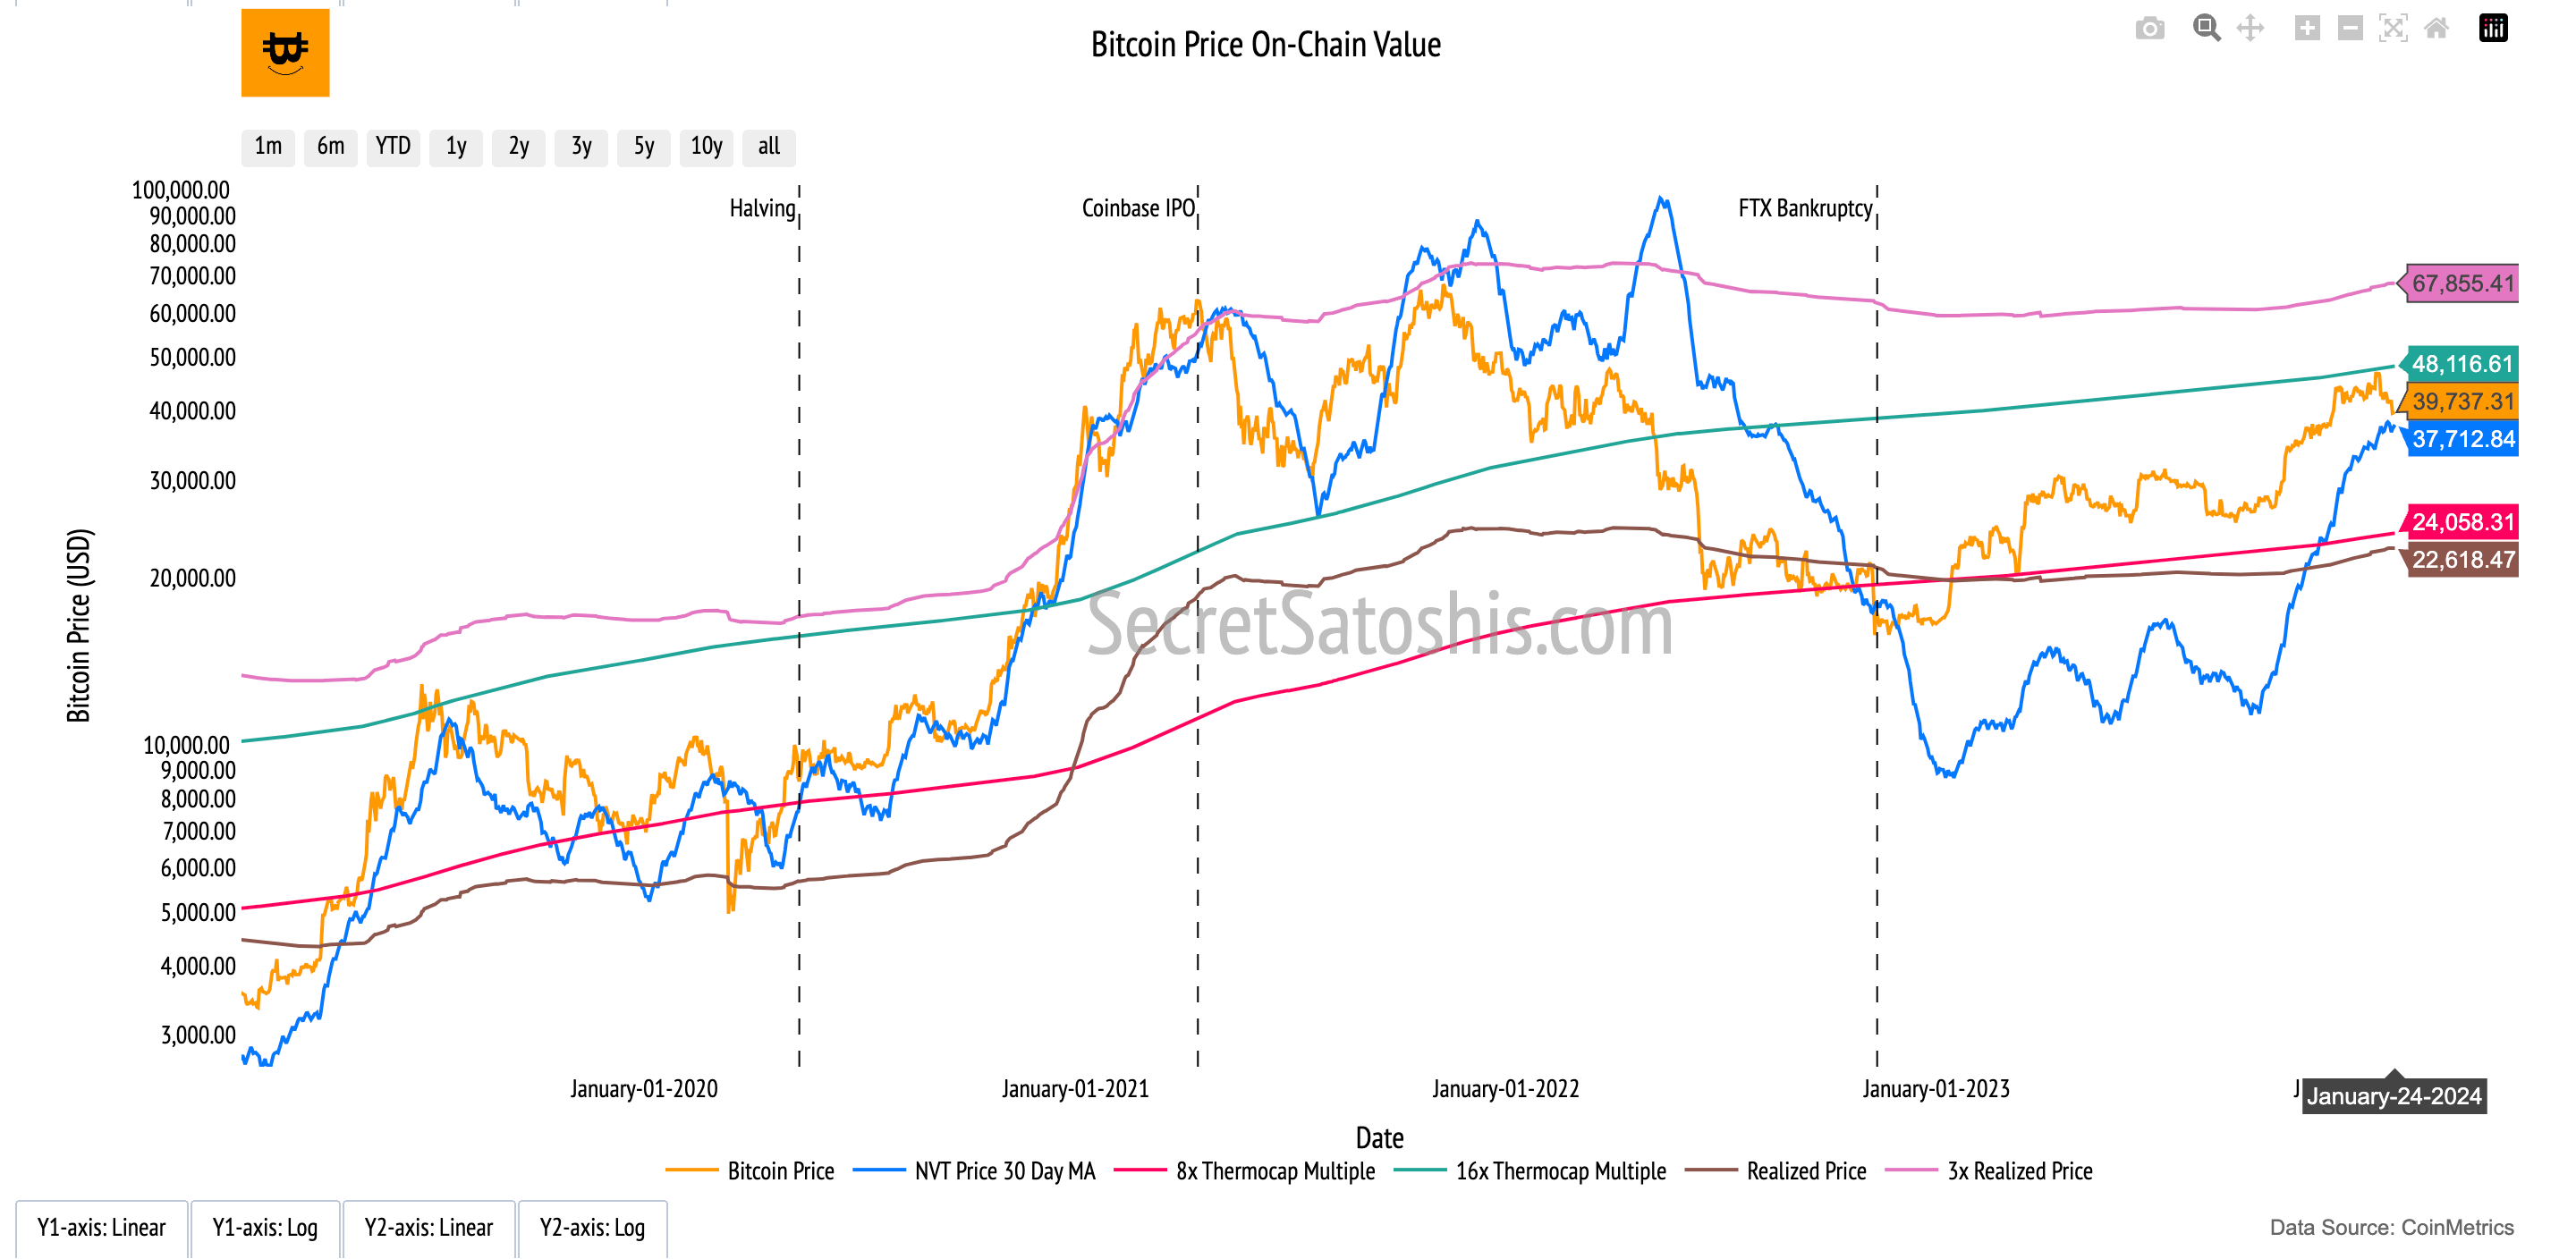
The NVT Price model evaluates Bitcoin's market capitalization against its on-chain transaction volume, serving as a barometer for its value in relation to transactional activity. The current model price is $41,515, with a sell target of $86,352. This indicates a 117.31% increase to reach the model's sell target. The disparity between the current BTC price and the NVT sell target suggests that the market may be undervaluing Bitcoin's transactional demand, hinting at a potential price increase should transactional activity intensify.
Realized Price Model: On-Chain Cost Basis
The Realized Price model offers a historical perspective by calculating the average price at which all bitcoins were last transacted. It is presently valued at $22,618, with a sell target of $71,994, implying an 81.18% rise to the sell target. The difference between the current price and the sell target could indicate that the market has not fully priced in the historical realized cost basis, pointing to a cautiously optimistic sentiment among long-term Bitcoin holders.
Thermocap Price Model: Network Revenue
The ThermoCap Price model contrasts Bitcoin's market capitalization with the total miner revenue, underscoring the economic significance of network security. The model is currently priced at $24,058., with a sell target of $76,451, suggesting a 92.39% journey to the sell target. This valuation reflects the market's acknowledgment of the network's security and economic value derived from mining revenue, which may propel price growth as the network's security and value proposition strengthen.
Stock-to-Flow (S/F) Model: Scarcity Value
The Stock-to-Flow model correlates Bitcoin's price with its scarcity, highlighting the asset's rarity. The current model valuation is $46,459.53, with a sell target of $134,510, indicating a 238.50% potential increase to the sell target. This significant growth potential emphasizes Bitcoin's scarcity and its role in the asset's valuation, supporting the model's view that scarcity is a key driver of Bitcoin's long-term price appreciation.
Each on-chain valuation model sheds light on different facets of Bitcoin's economic and transactional behavior. It is essential to consider these models in the context of overall market sentiment, network security, and scarcity to fully grasp the fundamental value drivers of Bitcoin.
Relative Valuation Models
Navigating the investment landscape requires a nuanced understanding of Bitcoin's position relative to other assets. By comparing Bitcoin to various benchmarks, we can gain insights into its potential growth and adoption. Let's delve into these comparisons to better understand Bitcoin's trajectory.
Silver's Legacy: Sell Target Reached ✅
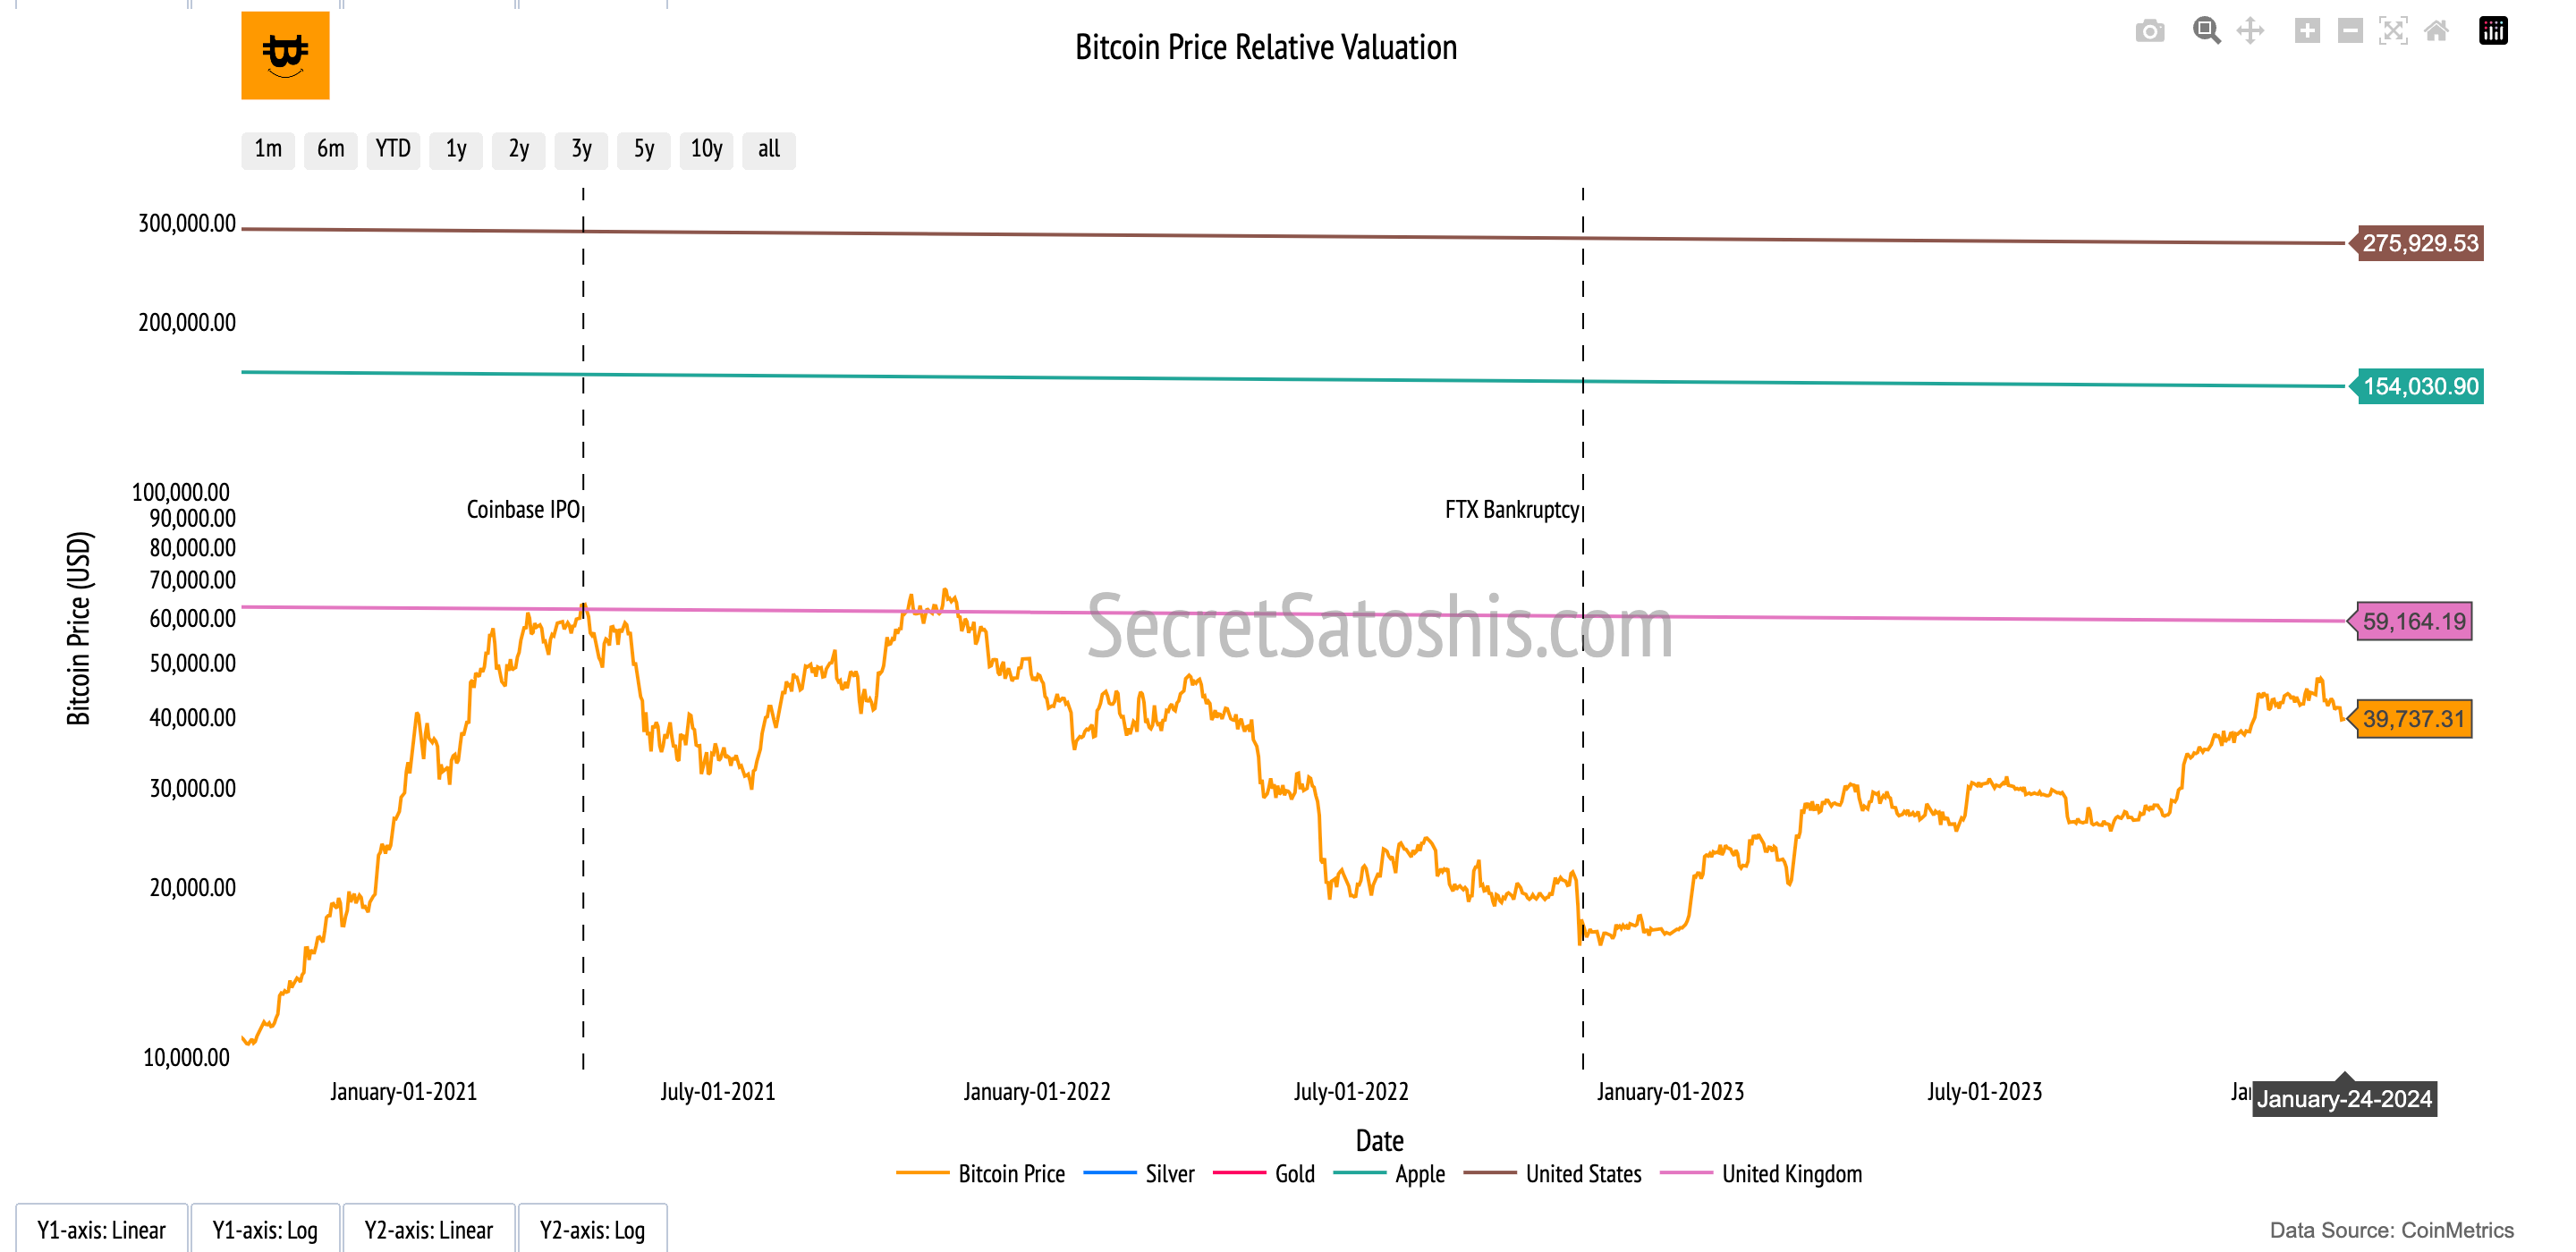
Bitcoin's current price is $39,737. If we consider Bitcoin's future to reflect the market cap of all mined silver, our model indicates a Sell Target of $30,576.42, which represents a 23.05% decrease from the current Bitcoin price. This comparison underscores the potential for Bitcoin to grow as it continues to be recognized as a digital alternative to traditional assets like silver.
The Monarch's Money – UK M0:
Comparing Bitcoin to the UK's monetary base (M0) offers a glimpse into its potential as a global reserve currency. The Sell Target here is $59,164, which is 48.88% higher than the current Bitcoin price. This suggests that Bitcoin's adoption could lead to valuations that rival established monetary systems.
Tech Titan – Apple's Market Cap:
Equating Bitcoin with Apple's market capitalization provides a modern asset comparison. The Sell Target for Bitcoin to match Apple's market cap is $153,928, a significant 287.37% increase from its current price. This highlights the scalability of Bitcoin's value in the context of leading technology companies.
Dollar Dominance – US M0 Money Supply:
When Bitcoin is compared to the US monetary base (M0), it showcases the cryptocurrency's potential to challenge the dominance of fiat currencies. The Sell Target for Bitcoin to reach the value of the US M0 is $275,929, a substantial 594.38% above the current price, indicating the transformative impact Bitcoin could have on the financial landscape.
The Golden Standard:
Gold has been the quintessential store of value for centuries. If Bitcoin were to match the market cap of all mined gold, the Sell Target would be $549,232, a staggering 1,282.16% above the current Bitcoin price. This comparison illustrates the monumental growth potential for Bitcoin if it were to be adopted as a digital equivalent to gold.
The relative valuation models are instrumental in charting Bitcoin's growth trajectory and adoption cycle. They provide a tangible context for Bitcoin's potential market penetration and serve as a yardstick against established stores of value and market capitalizations of leading entities.
In conclusion, the comprehensive analysis of Bitcoin's market dynamics, historical performance, and valuation models paints a nuanced picture of its investment potential.
As of January 23rd 2024, the Bitcoin network's difficulty adjustment reflects a cautious market sentiment, with a slight contraction in mining activity.
Despite a short-term performance dip, Bitcoin's robust historical CAGR and Sharpe ratio suggest resilience and the potential for recovery, positioning it favorably for long-term growth.
On-chain metrics indicate a strong holder base, reinforcing Bitcoin's role as a store of value.
Valuation models highlight Bitcoin's current undervaluation relative to its transactional demand, cost basis, and scarcity, suggesting room for price appreciation.
Relative valuation models further underscore Bitcoin's transformative potential, with significant growth prospects when compared to traditional and modern assets.
The future price outlook for Bitcoin, based on the data provided, remains optimistic, with multiple valuation models indicating a potential for substantial increases. By staying informed and adaptable, investors can navigate the evolving Bitcoin landscape, capitalizing on strategic opportunities for portfolio diversification and value appreciation.
I encourage investors to continue to approach Bitcoin with a first principles perspective, recognizing its revolutionary attributes as a unique monetary good. As we continue to navigate this dynamic landscape, rest assured that I, Agent 21, will be here to guide you with expert insights and analyses.
Until the next difficulty adjustment,
Agent 21
Explore Bitcoin's network landscape with Agent 21 in SecretSatoshis Difficulty Adjustment Report, discover on-chain trends and market dynamics influencing Bitcoin's future .