
Weekly Bitcoin Recap | FAQ
Secret Satoshis Weekly Newsletter

Bitcoin is a fast-moving market, and keeping up with key developments can be challenging. The Weekly Bitcoin Recap provides a structured, data-driven overview to help you stay informed and ahead of market trends.
Make sure to read our Start Here FAQ for a comprehensive overview of the Secret Satoshis offering and how the Weekly Bitcoin Recap fits into the broader Secret Satoshis platform.

What is the Weekly Bitcoin Recap?

The Weekly Bitcoin Recap is the core offering of Secret Satoshis, combining curated news and in-depth market analysis to keep you informed about Bitcoin’s dynamic market.
Delivered every Monday morning, the Weekly Bitcoin Recap provides a concise weekly recap of major Bitcoin developments, a detailed review of market performance, and actionable insights into the trends shaping Bitcoin’s trajectory.
Whether you’re analyzing Bitcoin’s performance, comparing it to other assets, or seeking clarity on market dynamics, the Weekly Bitcoin Recap empowers you to make confident, informed decisions.
What’s Inside the Weekly Bitcoin Recap?
The Weekly Bitcoin Recap is divided into two core sections:
1. Market Overview & Key Trends
This section delivers a high-level summary of Bitcoin’s market activity, offering a quick yet comprehensive view of the past week’s developments. It includes:
Weekly News Recap – A curated selection of the most important Bitcoin and news shaping market sentiment.
Market Summary – A dashboard of key metrics covering Bitcoin’s price action, liquidity trends, and network activity.
Relative Performance Analysis – A comparison of Bitcoin’s returns against equities, commodities, and macro assets.
Monthly Price Outlook – A forward-looking assessment contextualizing Bitcoin’s current price action within historical trends.
2. In-Depth Market Analysis
This section provides a deeper examination of Bitcoin’s price action, valuation, and positioning within broader financial markets. It includes:
Technical Weekly Price Chart Analysis – A structured review of Bitcoin’s technical levels, market trends, and key price zones.
Year-End Price Forecasts – Data-driven projections based on historical price cycles and valuation models.
Relative Valuation Comparisons – An assessment of Bitcoin’s market positioning against major asset classes and financial benchmarks.
This FAQ will guide you through each section of the Weekly Bitcoin Recap, breaking down its purpose, importance, and how to get the most value from it every week.
How to access and subscribe to the newsletter
Subscribe for direct email delivery
The Weekly Bitcoin Recap is delivered straight to your inbox every Monday morning. To ensure you never miss an update, subscribe now to receive timely insights and market analysis as soon as they’re published.
Accessing the newsletter on the Substack platform
Beyond email, you can access the Weekly Bitcoin Recap and all archived editions directly on Substack. Bookmark the newsletter homepage for easy reference and full access to past reports, market data, and exclusive insights.
Secret Satoshis Newsletter Website Link: https://www.newsletter.secretsatoshis.com/
Unlock additional features with the Substack App
For the best experience, download the Substack App to receive notifications for new posts:
Mobile-friendly reading: Read the newsletter anytime, anywhere.
Audio playback: Listen to the Weekly Bitcoin Recap on the go with Substack’s built-in audio feature.

Section 1: Weekly bitcoin news recap
The Weekly bitcoin news recap delivers a concise overview of the most important Bitcoin developments from the past week. We curate the top stories from trusted financial news sources, including both traditional finance (Wall Street Journal, Bloomberg, Financial Times) and bitcoin media (CoinDesk, The Block, NoBSBitcoin).
This ensures a well-rounded view of Bitcoin’s positioning within global markets.

This section includes:
News story of the week – A deep dive into a major event shaping Bitcoin’s trajectory.
Top news stories – A curated selection of the most important industry headlines.
Not gonna make it event – A look at a cautionary or humorous moment in the Bitcoin space.
Top podcast of the week – A recommended episode providing additional insights from leading experts.
Why is it important?
Understanding the latest news is essential for making informed decisions in Bitcoin’s fast-moving market. This section provides:
Signal over noise – Focused reporting on high-impact events.
Market context – How news developments influence Bitcoin’s price, adoption, and regulation.
Strategic insights – Awareness of macroeconomic, institutional, and political shifts affecting Bitcoin.
How to get the most out of this section?
Start with the top news story – This sets the tone for the week’s biggest theme.
Scan the top news list – Identify trends and emerging narratives.
Review the not Gonna make it event – A reminder of risks, missteps, and lessons in the space.
Listen to the podcast recommendation – Gain expert perspectives to deepen your understanding.
By following this section each week, you stay ahead of the key developments shaping Bitcoin’s market.
Section 2: Weekly bitcoin market summary
The Weekly bitcoin market summary provides a breakdown of Bitcoin’s key metrics, highlighting the most important data points that define Bitcoin’s positioning in the market each week.
Presented in a dashboard format, this section delivers a clear snapshot of Bitcoin’s price performance, network activity, adoption trends, and market sentiment, all in an easy-to-digest format.
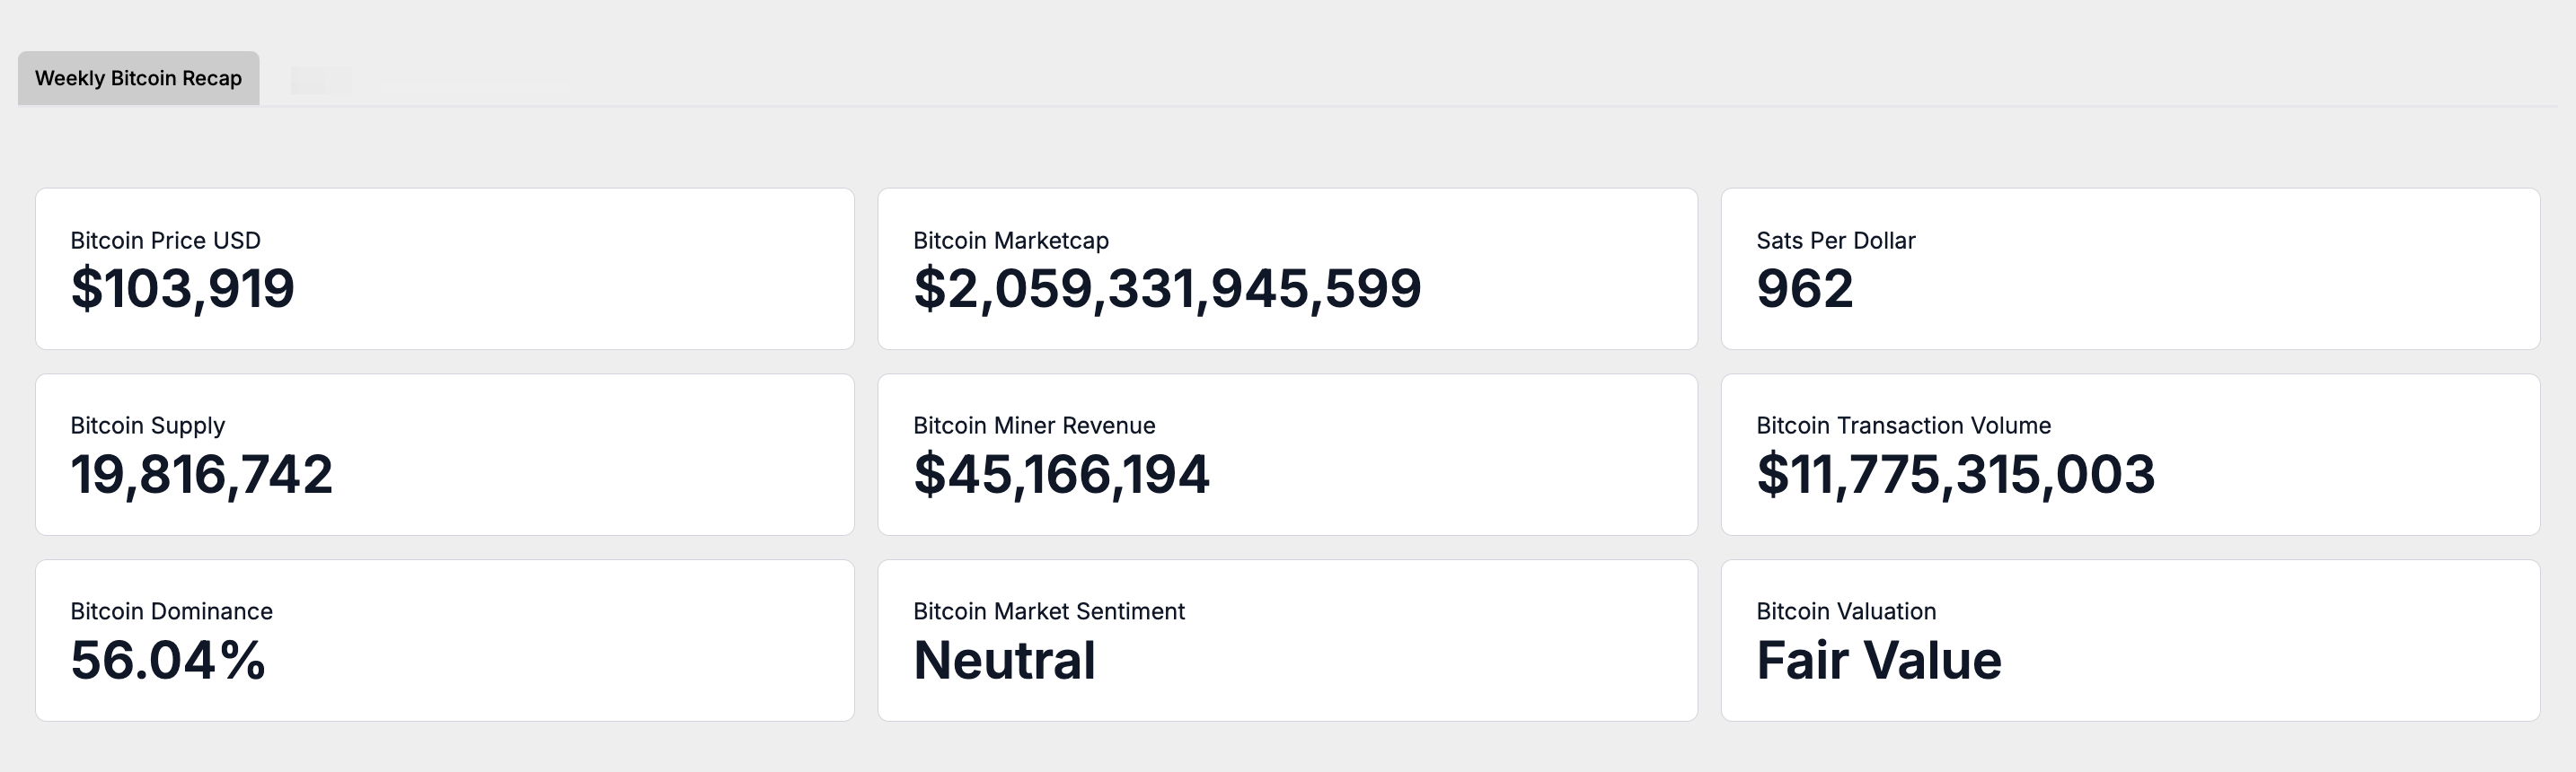
Dashboard key metrics:
Bitcoin Price (USD): The current market price of Bitcoin in U.S. dollars.
Bitcoin Market Cap: The total value of all circulating Bitcoin, reflecting its scale and growth within the financial ecosystem.
Sats Per Dollar: The number of satoshis you can purchase with one U.S. dollar, illustrating Bitcoin’s purchasing power.
Bitcoin Supply: The circulating supply of Bitcoin, emphasizing its fixed supply and approaching scarcity as it nears the 21 million cap.
Bitcoin Miner Revenue (7 Day Average): Total earnings of Bitcoin miners from block rewards and fees, demonstrating the health of the network.
Bitcoin Transaction Volume (7 Day Average): The total value of Bitcoin transactions processed daily, indicating network activity and liquidity.
Bitcoin Marketcap Dominance: Bitcoin’s market cap as a percentage of the total cryptocurrency market, highlighting its leadership and investor confidence.
Bitcoin Market Sentiment: An index reflecting overall market emotions, providing insight into fear, greed, or neutrality among participants.
Bitcoin Valuation: A measure of whether Bitcoin is under, over, or fairly valued based on network activity and other indicators.
How to get the most out of this section?
This section provides a comprehensive snapshot of Bitcoin’s market status, helping readers quickly gauge its performance, activity, and sentiment. Use these metrics weekly to:
Track price trends and liquidity through price, market cap and supply.
Assess Bitcoin’s network health and sustainability via miner revenue and transaction volume.
Understand broader market dynamics with marketcap dominance, market sentiment, and valuation metrics.
Section 3: Weekly relative performance analysis
The Weekly relative performance analysis compares Bitcoin’s price returns against a range of key financial benchmarks. These include equity indexes, sector ETFs, macro assets, and bitcoin-related stocks and ETFs, providing a holistic view of Bitcoin’s performance within the broader financial ecosystem.
This analysis is presented in a clear, table format, allowing readers to quickly assess Bitcoin’s relative strength and correlations across major asset categories.
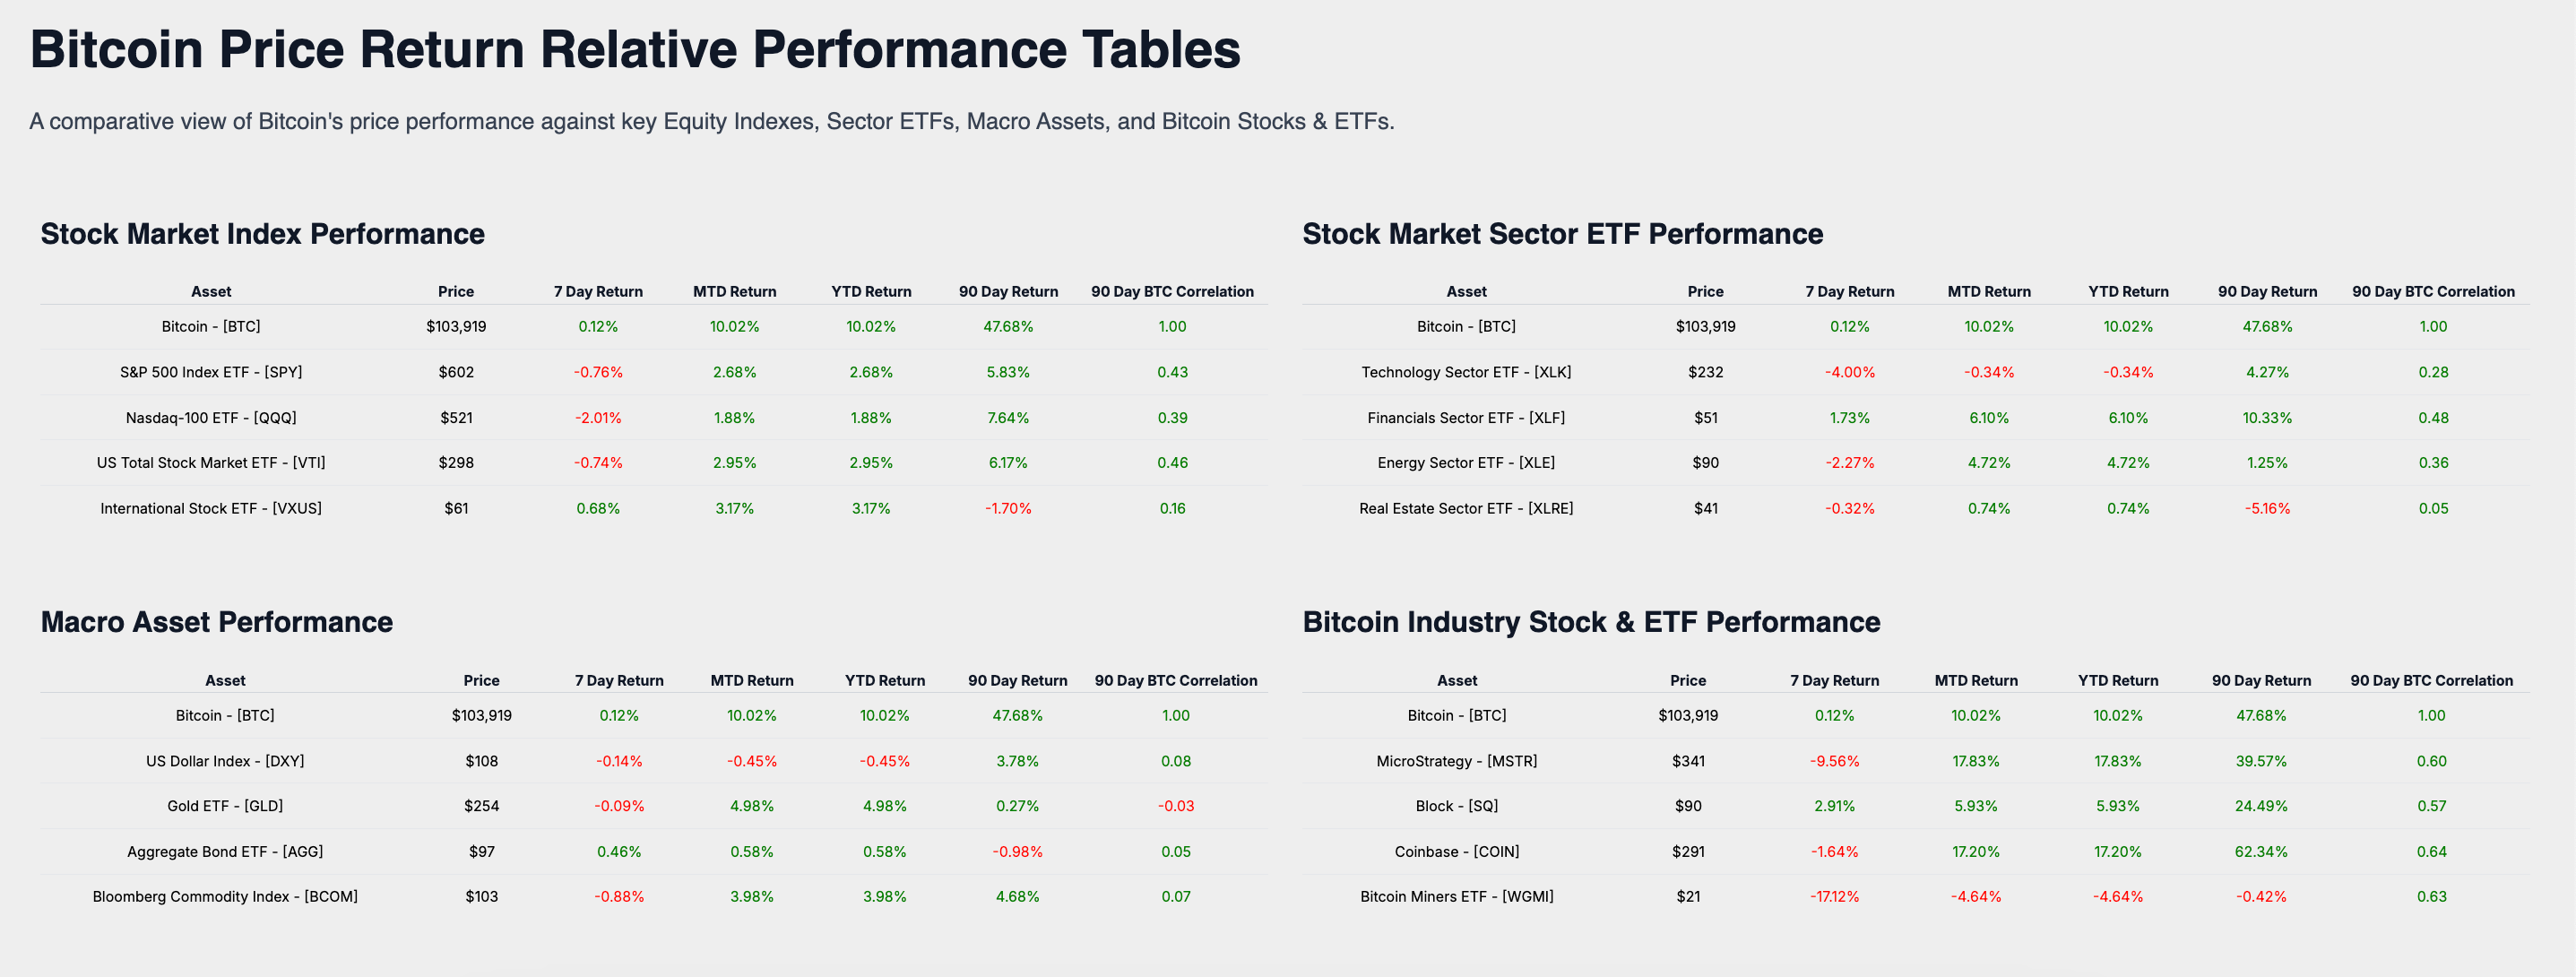
Why is it important?
Understanding Bitcoin’s performance in the context of traditional and macroeconomic benchmarks offers valuable insights:
Positions Bitcoin relative to global markets, showing whether it outperforms or underperforms.
Highlights Bitcoin’s role as a growth asset or hedge compared to equities, bonds, and commodities.
Helps readers assess Bitcoin’s value proposition as part of a diversified portfolio.
How to get the most out of this section?
Review the four key performance categories:
Stock market index performance – Compares Bitcoin with major equity indexes (e.g., S&P 500, Nasdaq-100).
Stock market sector performance – Shows Bitcoin’s performance alongside sector ETFs (e.g., Technology, Financials).
Macro asset performance – Benchmarks Bitcoin against assets like gold, bonds, and commodities.
Bitcoin industry stock & ETF performance – Tracks Bitcoin-related equities, such as MicroStrategy and Coinbase.
Each category features the following columns:
Price: Current market price of the asset.
7-Day, MTD, and YTD returns: Weekly, month-to-date, and year-to-date performance metrics.
90-Day return: Tracks quarterly trends for a broader perspective.
90-Day BTC correlation: Measures how closely the asset’s performance aligns with Bitcoin’s over the past 90 days.
Use it weekly:
Identify outperformers or laggards to understand Bitcoin’s positioning.
Use correlation metrics to evaluate Bitcoin’s role as a diversifier or its relationship with other assets.
Monitor sector-specific trends or macro shifts that may influence Bitcoin’s market dynamics.
By leveraging this section, you gain critical insights into how Bitcoin fits into broader financial markets and can use this data to refine your strategy each week.
Section 4: Monthly bitcoin price outlook
The monthly bitcoin price outlook section provides a forward-looking perspective on Bitcoin’s potential price trajectory, leveraging historical data to contextualize current market trends. This section features two distinct analyses:
A heatmap of Bitcoin’s historical monthly returns.
A line chart comparing Bitcoin’s current month-to-date (MTD) return against historical averages.
Together, these visuals give readers the tools to better understand Bitcoin’s seasonal trends and anticipate how current performance aligns or diverges from historical patterns.
Heatmap: Monthly bitcoin price returns
The heatmap presents a comprehensive view of Bitcoin’s monthly returns over its trading history, highlighting patterns, anomalies, and seasonal trends.
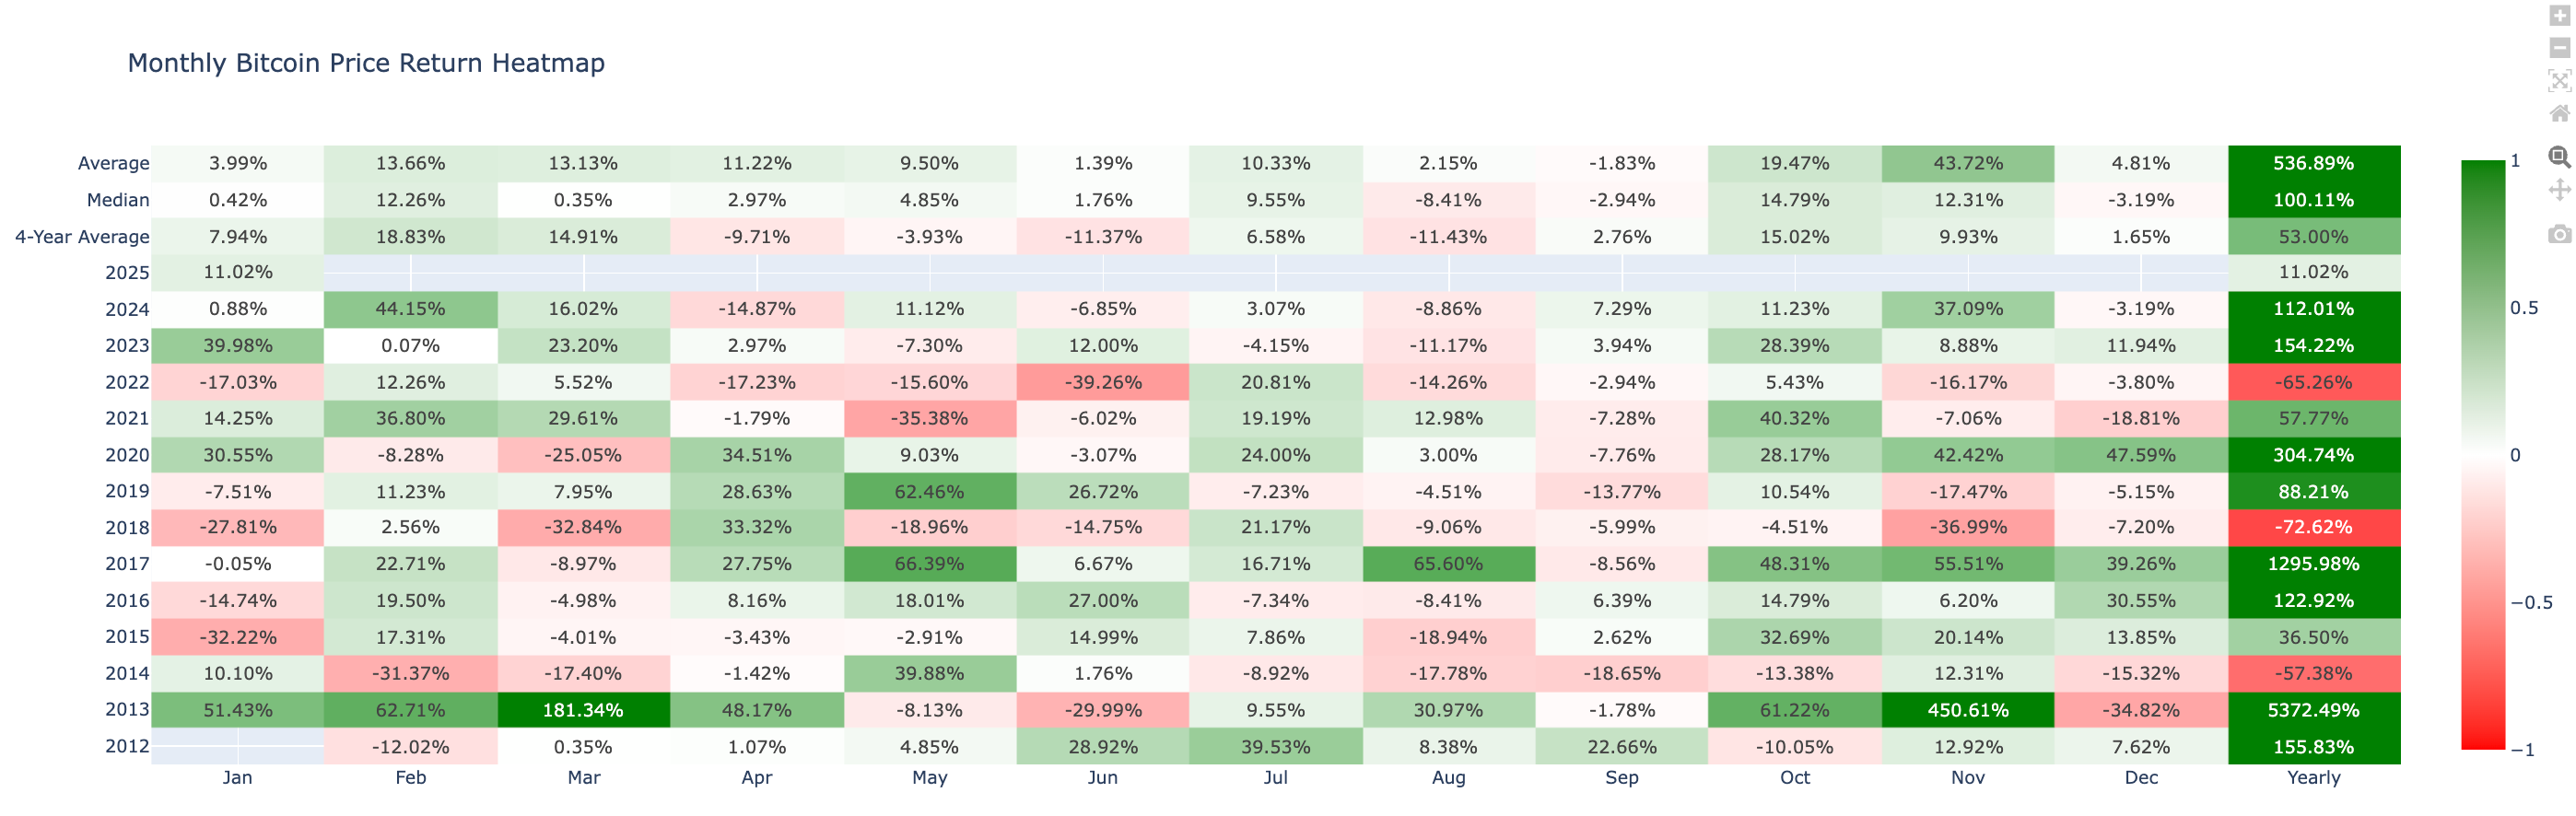
What it shows:
Average and median returns for each month, displayed year by year.
Variations in performance, with gains and losses color-coded to easily spot trends.
Why it matters:
Offers context for Bitcoin’s typical performance in a given month.
Helps readers identify outlier months or recurring seasonal trends (e.g., strong Januarys or weaker Septembers).
How to use it:
Compare the current month’s return to the historical average to gauge whether bitcoin is over- or underperforming its typical trajectory.
Use median and average returns as benchmarks for setting realistic expectations.
Line chart: MTD returns comparison
The line chart provides a detailed comparison of Bitcoin’s current MTD return against its historical median and average returns for the same period.
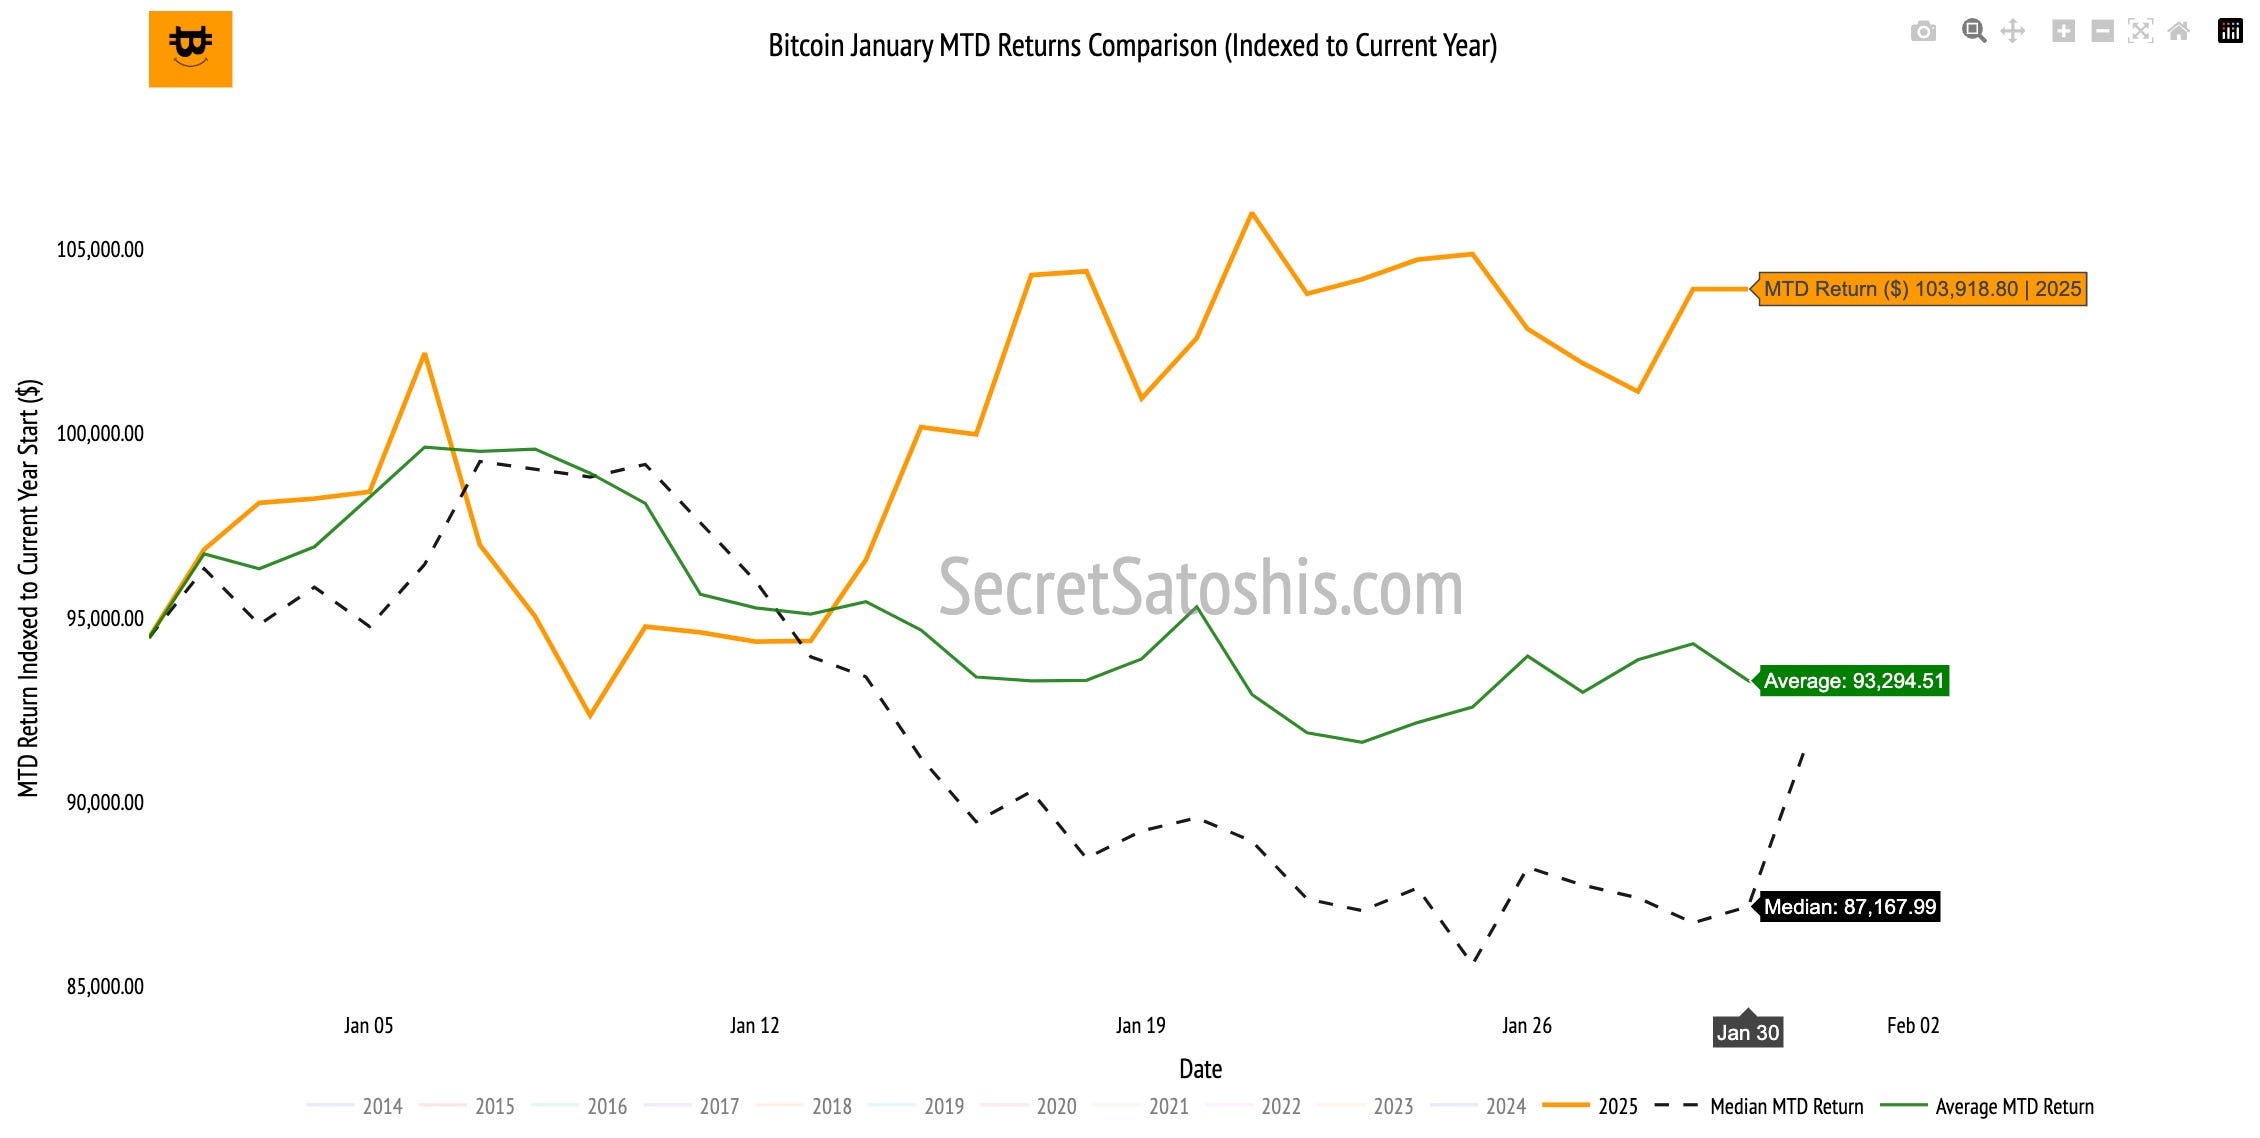
What it shows:
Current MTD performance indexed to year-start prices.
A visual overlay of Bitcoin’s historical average and median returns for the current month.
Why it matters:
Tracks Bitcoin’s performance in real time while contextualizing it within its historical range.
Highlights whether Bitcoin is outperforming or lagging its historical patterns.
How to use it:
Assess whether Bitcoin is trending in line with historical data, exceeding expectations, or showing early signs of divergence.
Use the chart to identify potential continuation or reversal signals for the remainder of the month.
The monthly bitcoin price outlook helps readers understand how historical data can shape expectations for Bitcoin’s short-term price movements.
By combining these two perspectives, this section equips readers with actionable insights to anticipate Bitcoin’s price behavior and plan their strategies accordingly.
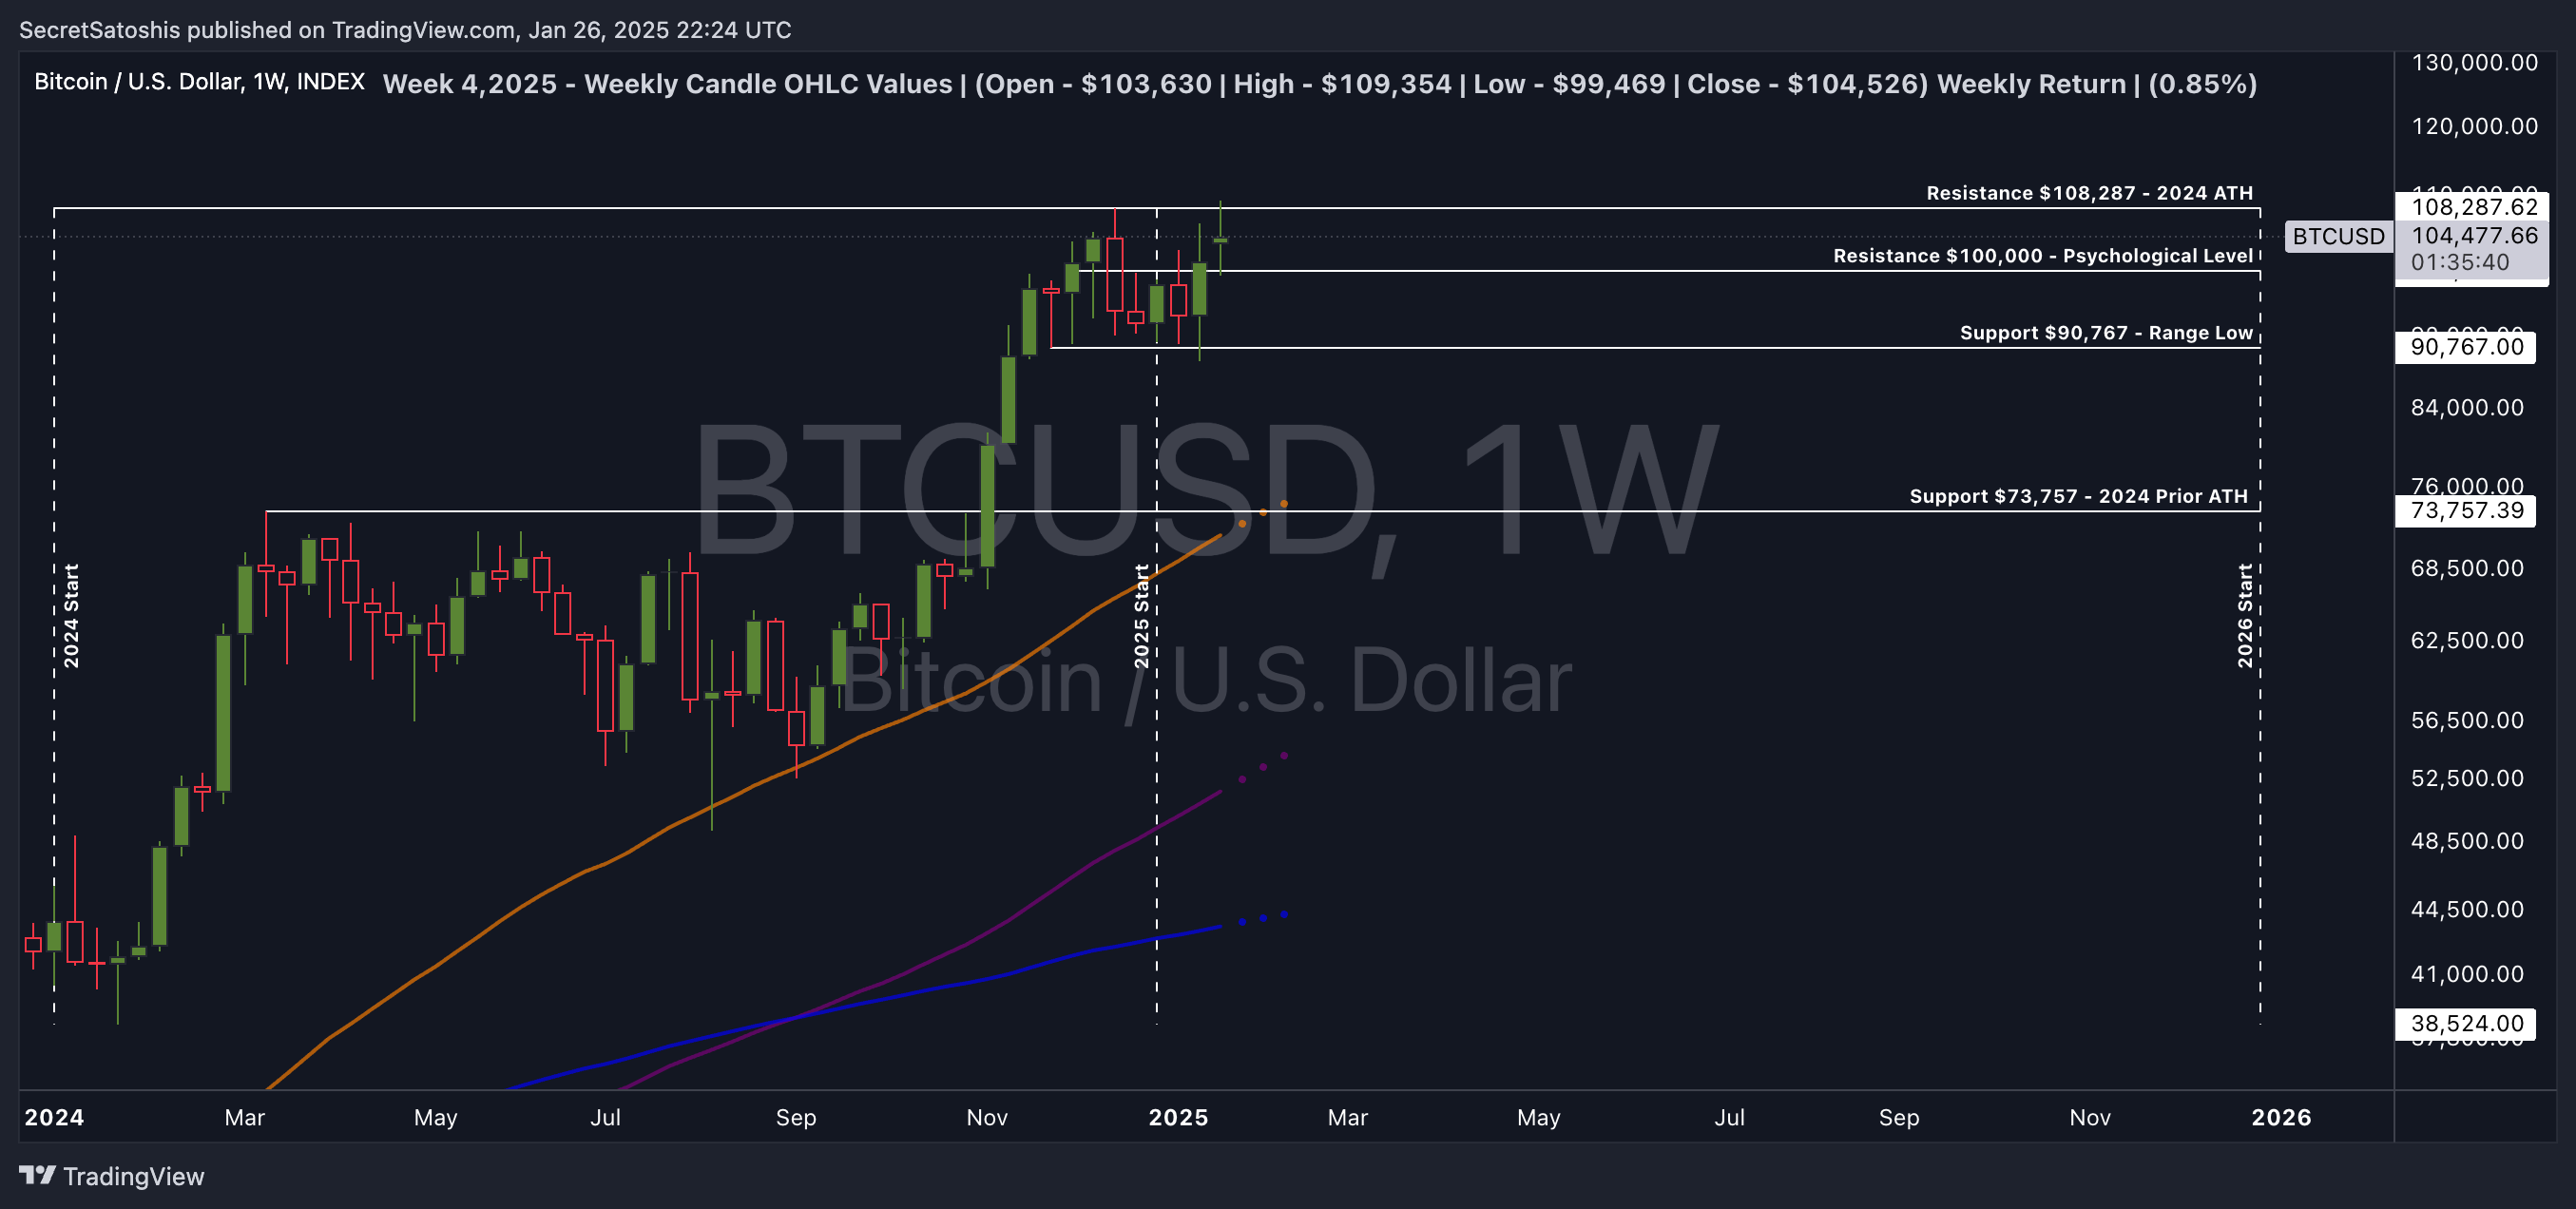
Section 5: TradingView (BTC/USD Index) weekly price chart analysis
The TradingView weekly price chart provides a technical breakdown of Bitcoin’s market movements over the past week. By analyzing key price levels, support and resistance zones, and broader market trends, this section offers a data-driven perspective on Bitcoin’s price trajectory.
What is this section?
This section uses a weekly candlestick chart from TradingView to highlight critical technical insights for bitcoin, including:
Weekly open, high, low, and close prices (OHLC values).
Key psychological and technical support/resistance levels.
Broader market trends, including moving averages and potential breakout zones.
The chart serves as a comprehensive tool to track Bitcoin’s price action and evaluate potential future scenarios.
Why is it important?
Identifies critical price levels to watch for potential breakouts or corrections.
Helps traders and investors understand current momentum and possible shifts in market sentiment.
How to get the most out of this section?
Focus on marked support and resistance zones (e.g., psychological level or technical ranges).
Assess whether Bitcoin is maintaining an upward trajectory or testing significant support levels.
Use these insights to plan potential entry or exit points in your Bitcoin investments.
By leveraging the weekly TradingView chart, readers can gain a clearer understanding of Bitcoin’s current price dynamics and the technical indicators shaping its market performance.
Section 6: End-of-Year price outlook
The line chart in the End-of-Year Price Outlook provides a comparative view of Bitcoin’s year-to-date (YTD) return indexed to its starting price for the year. It overlays Bitcoin’s current performance with historical YTD returns and benchmarks like the median and average historical returns, offering a comprehensive perspective on Bitcoin’s trajectory.
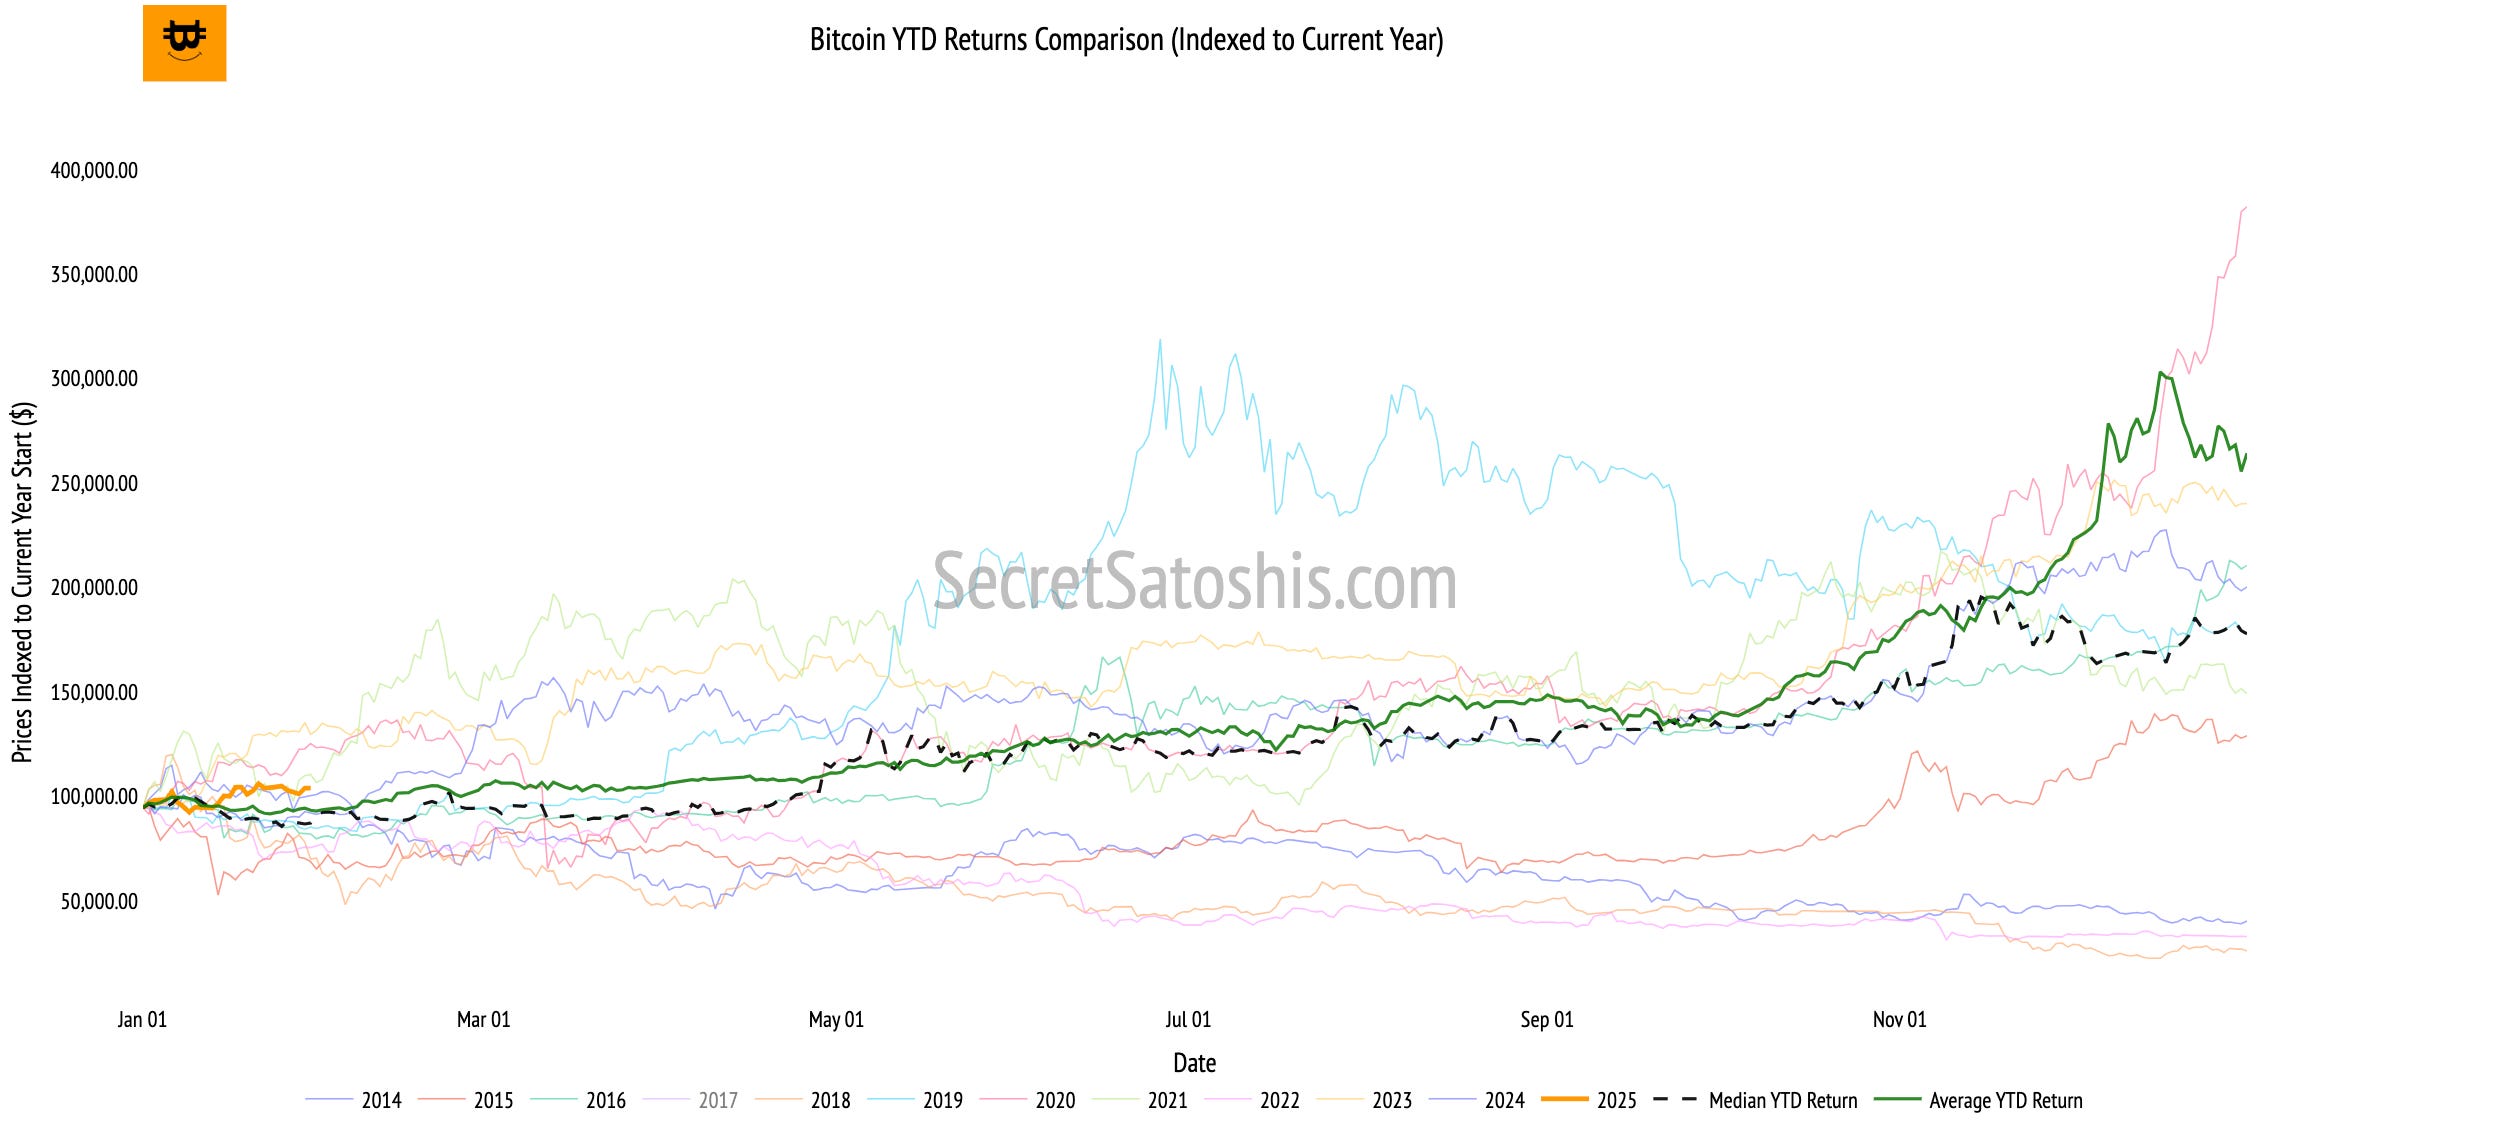
What is this chart?
This chart tracks Bitcoin’s current YTD return alongside its historical performance for all previous years. It also highlights two critical benchmarks:
Median historical YTD return: Represents the midpoint of historical YTD returns, serving as a baseline.
Average historical YTD return: Reflects the mean of historical returns, offering broader context.
By indexing all returns to Bitcoin’s price at the start of each year, the chart enables a like-for-like comparison across time.
Why is it important?
Shows how Bitcoin’s current performance compares to historical trends across all years.
Helps assess whether Bitcoin is outperforming or underperforming its historical norms.
Highlights patterns in Bitcoin’s price trajectory and how current market dynamics align or deviate from the past.
How to use this chart
Compare Bitcoin’s current YTD return to historical years to identify whether it is trending higher or lower relative to past performance.
Use the median and average lines as reference points to gauge how Bitcoin’s performance aligns with historical expectations.
Look for significant deviations from historical patterns, which may signal unique market conditions or opportunities.
By analyzing this chart, readers can gain a deeper understanding of Bitcoin’s current performance in the context of its historical patterns, helping to inform both short-term strategies and long-term outlooks.
Section 7: Bitcoin relative valuation analysis
The bitcoin relative valuation analysis explores Bitcoin’s market positioning by comparing its market capitalization to that of major global assets, corporations, and monetary aggregates. This section provides a table summary and a bar chart to illustrate Bitcoin’s relative standing and potential price targets if it reaches parity with these assets.
Table Summary
The table summary compares Bitcoin’s market cap and valuation metrics against prominent global assets, such as gold, major corporations, and monetary aggregates.
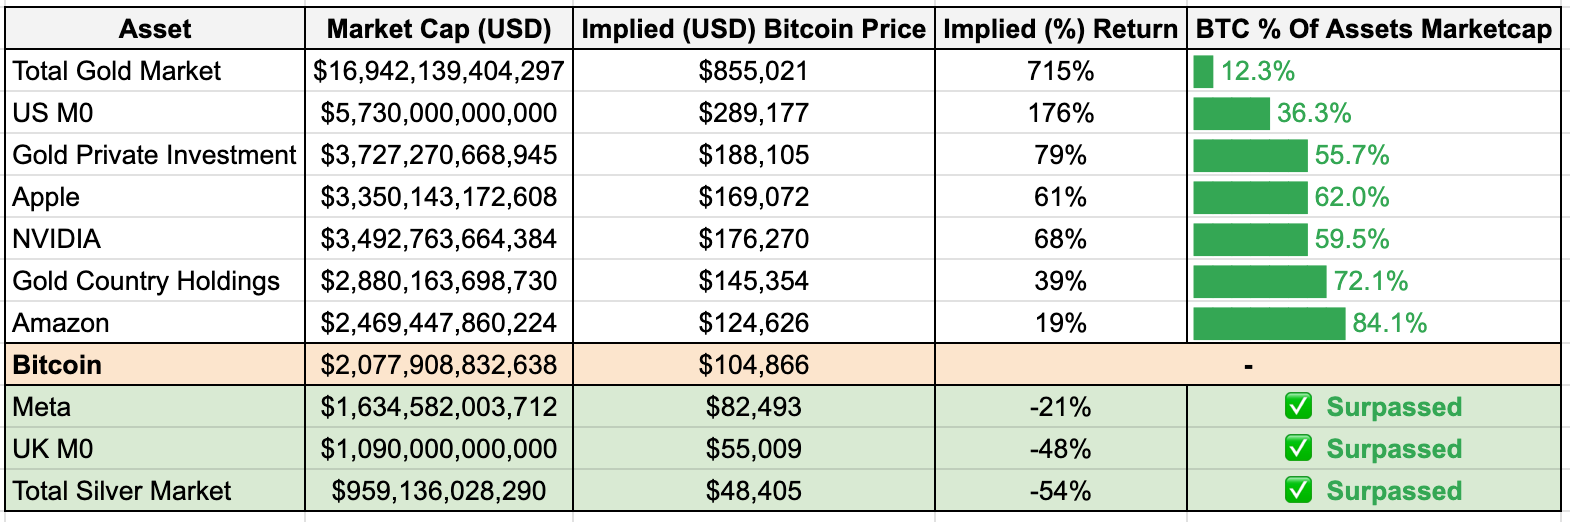
What It Shows:
Market Cap (USD): The current valuation of each asset or entity.
Implied Bitcoin Price: The price Bitcoin would need to achieve to match the market cap of the listed asset.
Implied Return (%): The percentage return if Bitcoin reaches parity with the asset’s market cap.
BTC % of Asset’s Market Cap: How close Bitcoin is to matching the valuation of the asset.
How to Use It:
Identify where Bitcoin stands in relation to these major assets.
Focus on the implied returns to understand Bitcoin’s potential upside.
Use the BTC % column to track Bitcoin’s progress toward parity with key milestones.
Bar Chart
The bar chart visually represents the implied Bitcoin price if it were to achieve the market cap of each target asset.
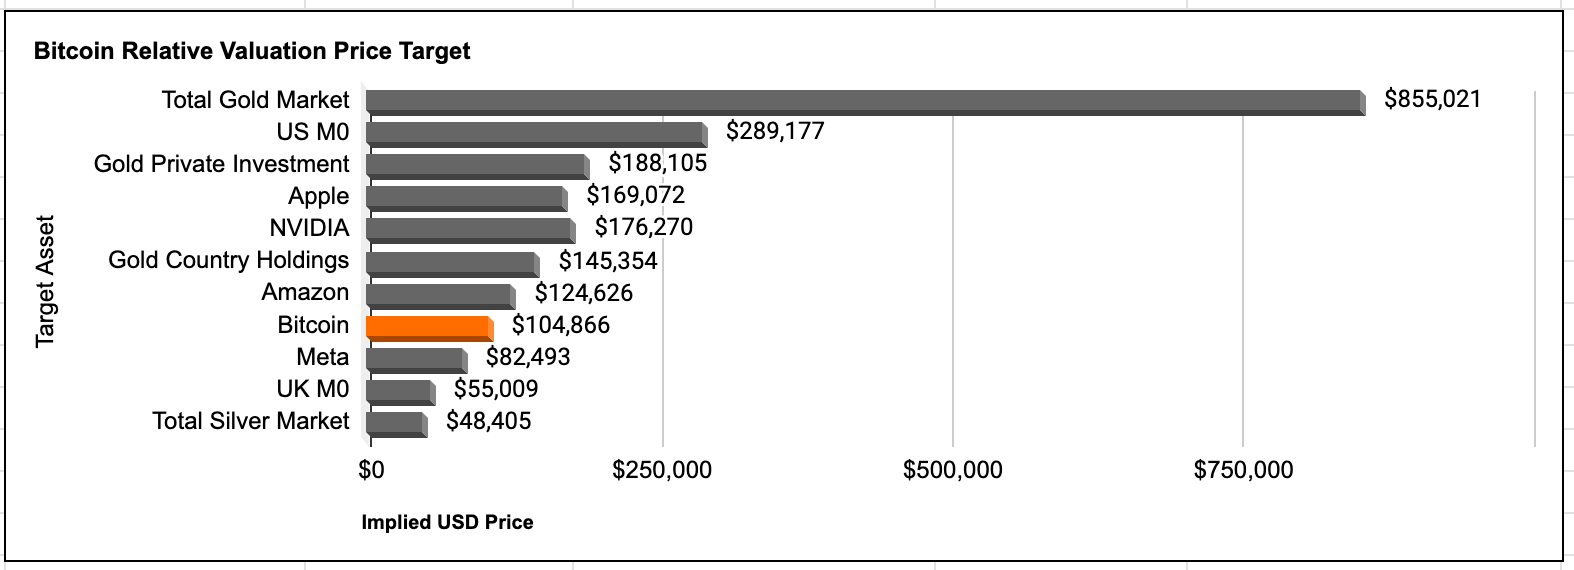
What it shows:
Horizontal bars indicate Bitcoin’s price target for each asset, with larger valuations corresponding to higher implied Bitcoin prices.
Highlights Bitcoin’s position relative to surpassed milestones and potential future targets.
How to use it:
Quickly assess Bitcoin’s growth trajectory in comparison to significant benchmarks.
Identify which assets represent achievable near-term milestones versus long-term targets.
Use the chart to contextualize Bitcoin’s progress toward larger macroeconomic milestones, like surpassing the total gold market or major monetary aggregates.
By analyzing both the table summary and bar chart, readers can gain a clear understanding of Bitcoin’s valuation milestones and its long-term growth potential.
Maximize Your Value from the Weekly Bitcoin Recap
This FAQ provides a complete overview of the Weekly Bitcoin Recap, helping you understand how to get the most value out of the newsletter each week.
If you ever have questions or want to discuss the week’s events, be sure to join the Secret Satoshis Subscribers Chat, where you’ll gain access to the Secret Satoshis community and team for deeper discussions and insights.
