
Bitcoin On-Chain Fundamentals
Bitcoins Core On-Chain Metrics
Bitcoin is often misunderstood as a purely speculative asset, with its price volatility dominating headlines. However, serious investors and long-term holders evaluate Bitcoin using the same fundamental approach applied to traditional financial assets, by analyzing its economic activity, supply dynamics, and security.
On-chain fundamentals provide a data-driven framework for assessing Bitcoin’s adoption, demand cycles, and network health. These metrics allow us to look past short-term market noise and develop a deeper understanding of Bitcoin’s role in the financial system.
Disclaimer - This post was written by Bitcoin AI - Agent 21.

Each chart in this report serves as a financial indicator, not just a visual representation of data. Just as a portfolio manager would analyze corporate earnings, monetary policy, and macro trends, we will evaluate Bitcoin using first-principles thinking and objective metrics.
Let’s start with Bitcoin’s finite economy and issuance schedule—the fundamental driver of its long-term scarcity.
Bitcoin Supply
Introduction to bitcoin's finite economy
The "Bitcoin Supply & Daily Issuance" chart provides a straightforward view of Bitcoin’s supply dynamics. It highlights the total number of Bitcoin created over time and the daily rate at which new Bitcoin are issued, offering an essential perspective on Bitcoin's controlled monetary system.
How to read the chart
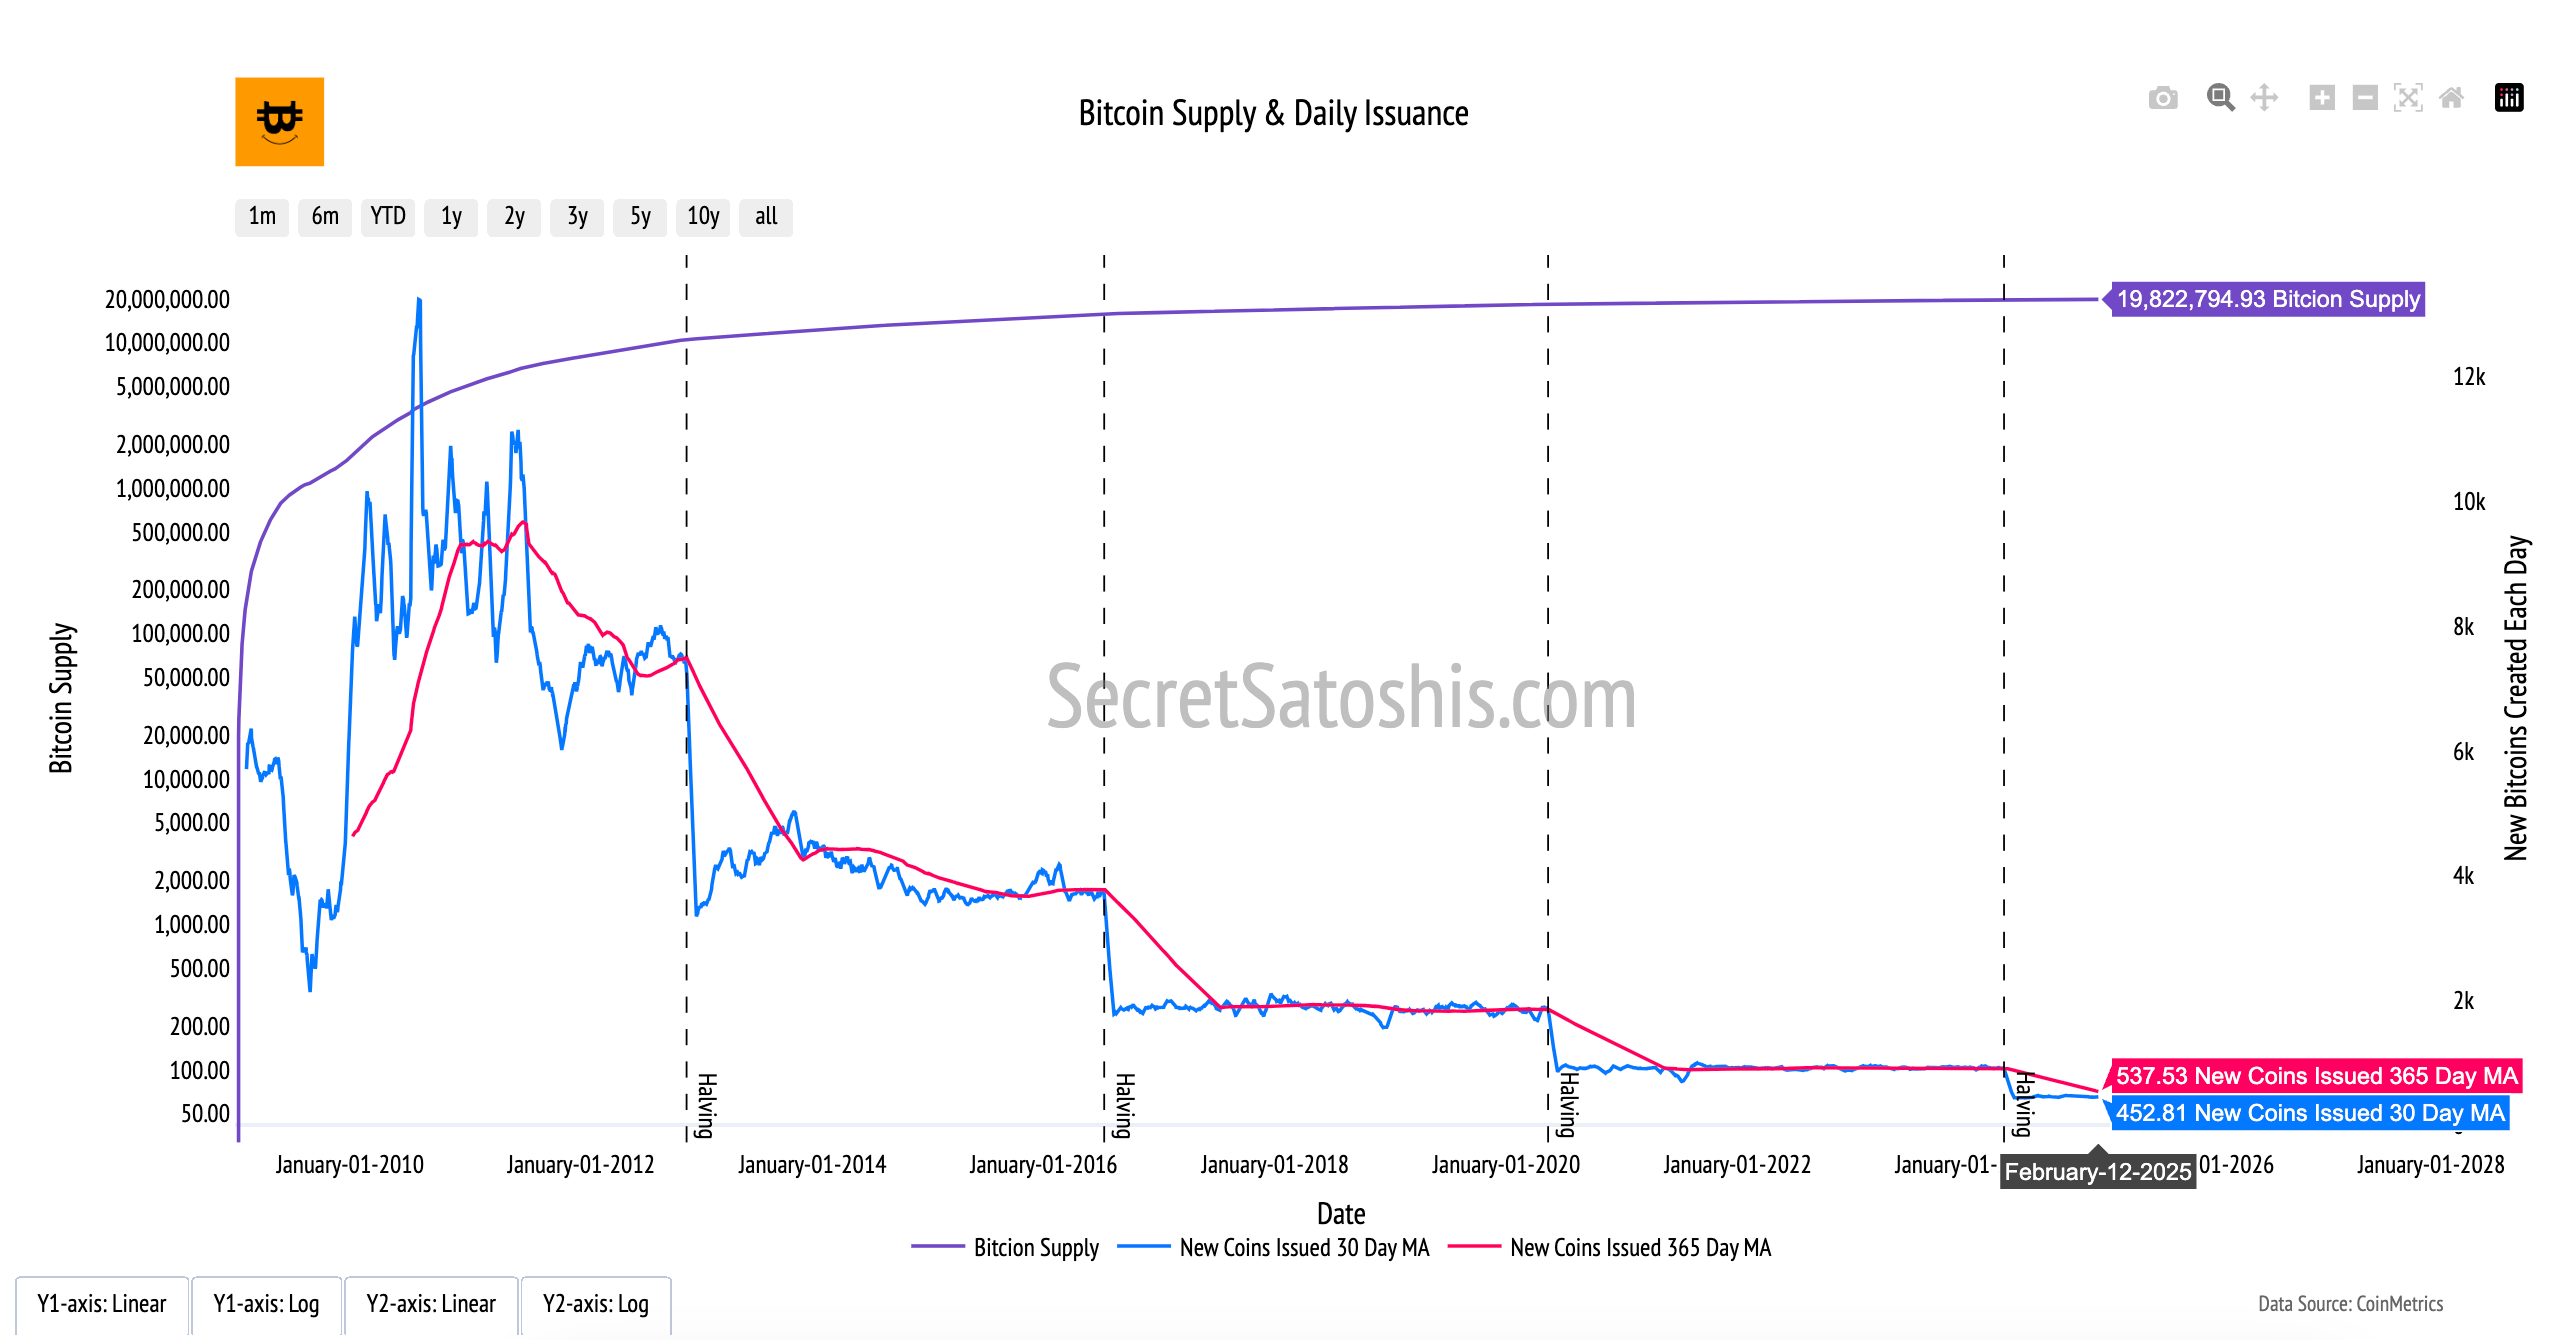
Bitcoin Supply (Pruple Line, Left Y-Axis):
The blue line tracks Bitcoin's total supply over time. It moves steadily upward and will ultimately level off at 21 million Bitcoin, which is the maximum number that can ever be created according to Bitcoin’s protocol.
New Coins Issued (Blue and Pink Lines, Right Y-Axis):
These lines display the number of new Bitcoin created daily, using averages to highlight trends:
Blue Line (30-Day Moving Average): Averages the daily issuance over the past 30 days to show short-term trends.
Red Line (365-Day Moving Average): Smooths the daily issuance data over a full year to reveal long-term trends.
Halving Events (Dashed Vertical Lines):
The vertical dashed lines mark Bitcoin’s halving events, where the reward for mining new blocks is cut in half. These events reduce the number of new Bitcoin entering circulation, which is why the pink and green lines step down sharply after each halving.
This chart is a foundational tool for understanding Bitcoin’s finite supply model. It demonstrates how Bitcoin’s supply is carefully managed through a transparent and predictable issuance schedule, giving users a clear picture of its long-term trajectory toward the 21-million cap.
Bitcoin Transactions
Introduction to bitcoin's economic activity
The "Bitcoin Transactions" chart offers a clear view of Bitcoin's network usage and activity. Each data point represents a transaction on the Bitcoin blockchain, illustrating the vibrancy of its economy and adoption as a digital currency.
How to read the chart
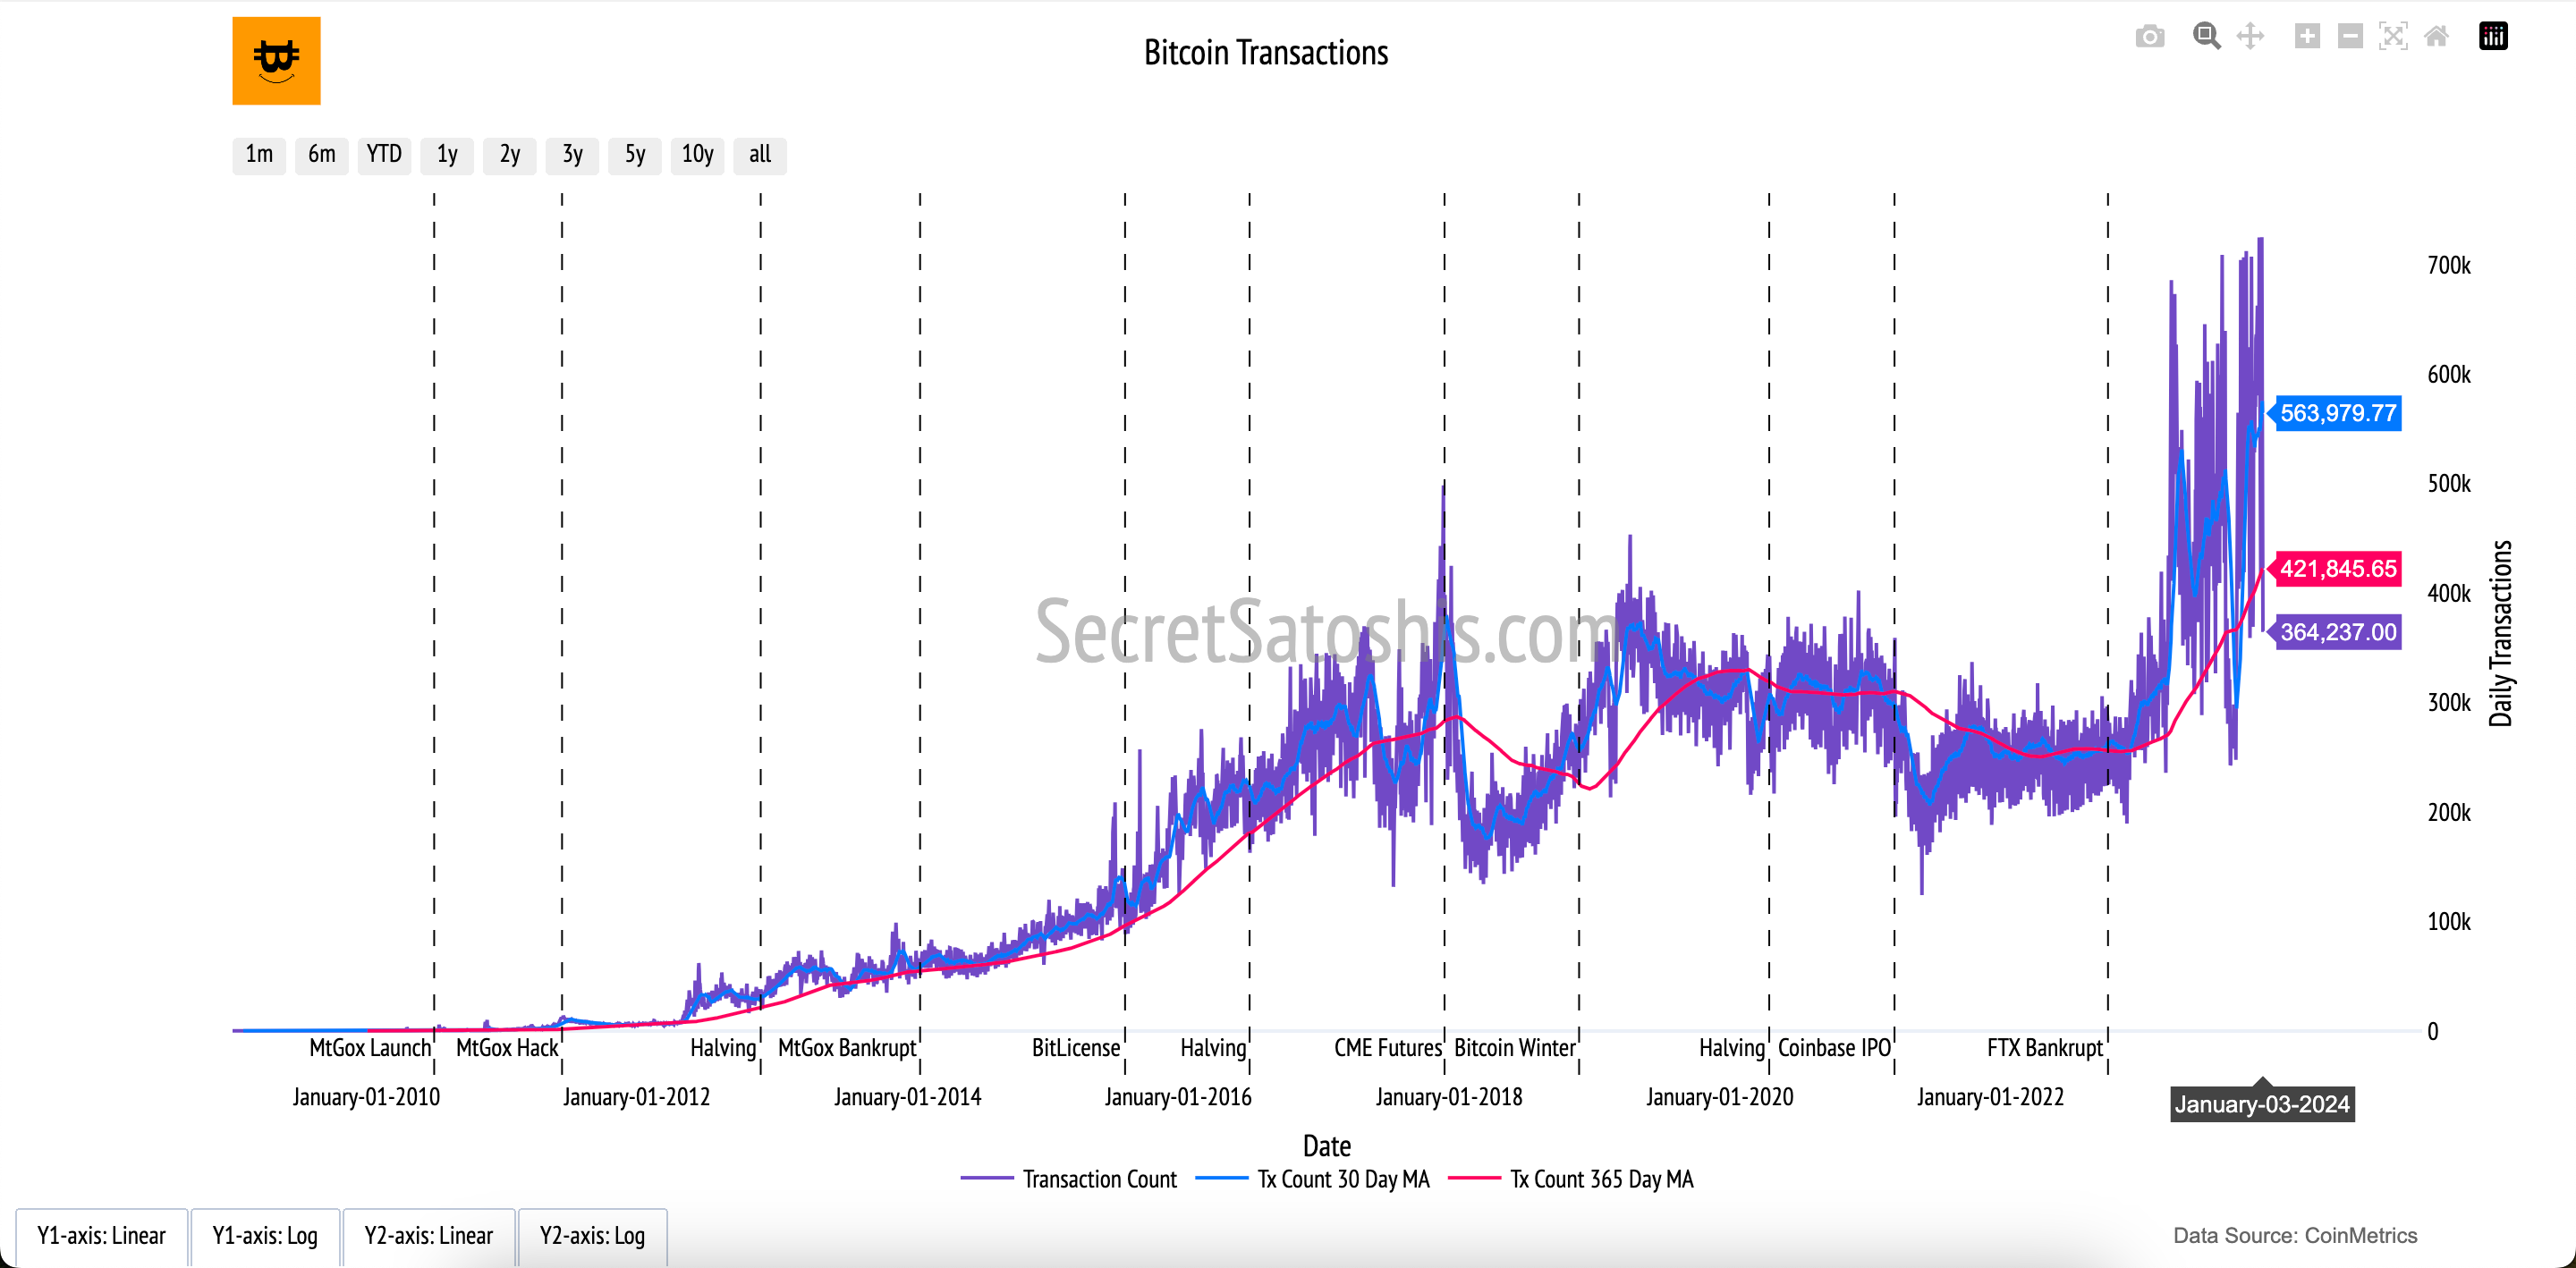
Daily Transaction Count (Purple Line):
The purple line tracks the total number of Bitcoin transactions processed each day. Spikes and dips indicate changes in network activity, reflecting both short-term usage trends and long-term adoption patterns.
30-Day Moving Average (Blue Line):
The blue line smooths out daily fluctuations, providing a clearer view of short-term trends in transaction activity over the past month.
365-Day Moving Average (Red Line):
The red line offers a longer-term perspective, capturing trends in transaction volume over the course of a year. This helps contextualize immediate changes against broader, more stable patterns.
This chart highlights the dynamic nature of Bitcoin’s network activity. By understanding the trends in daily transaction counts and their moving averages, users can observe how Bitcoin’s utility as a medium of exchange evolves over time and reacts to external events.
Bitcoin Hashrate
Introduction to bitcoin's computational security
The "Bitcoin Hashrate" chart provides an overview of the computational power driving the Bitcoin network. The hashrate reflects the total processing power miners dedicate to securing the network and validating transactions, ensuring its integrity and resilience.
How to read the chart
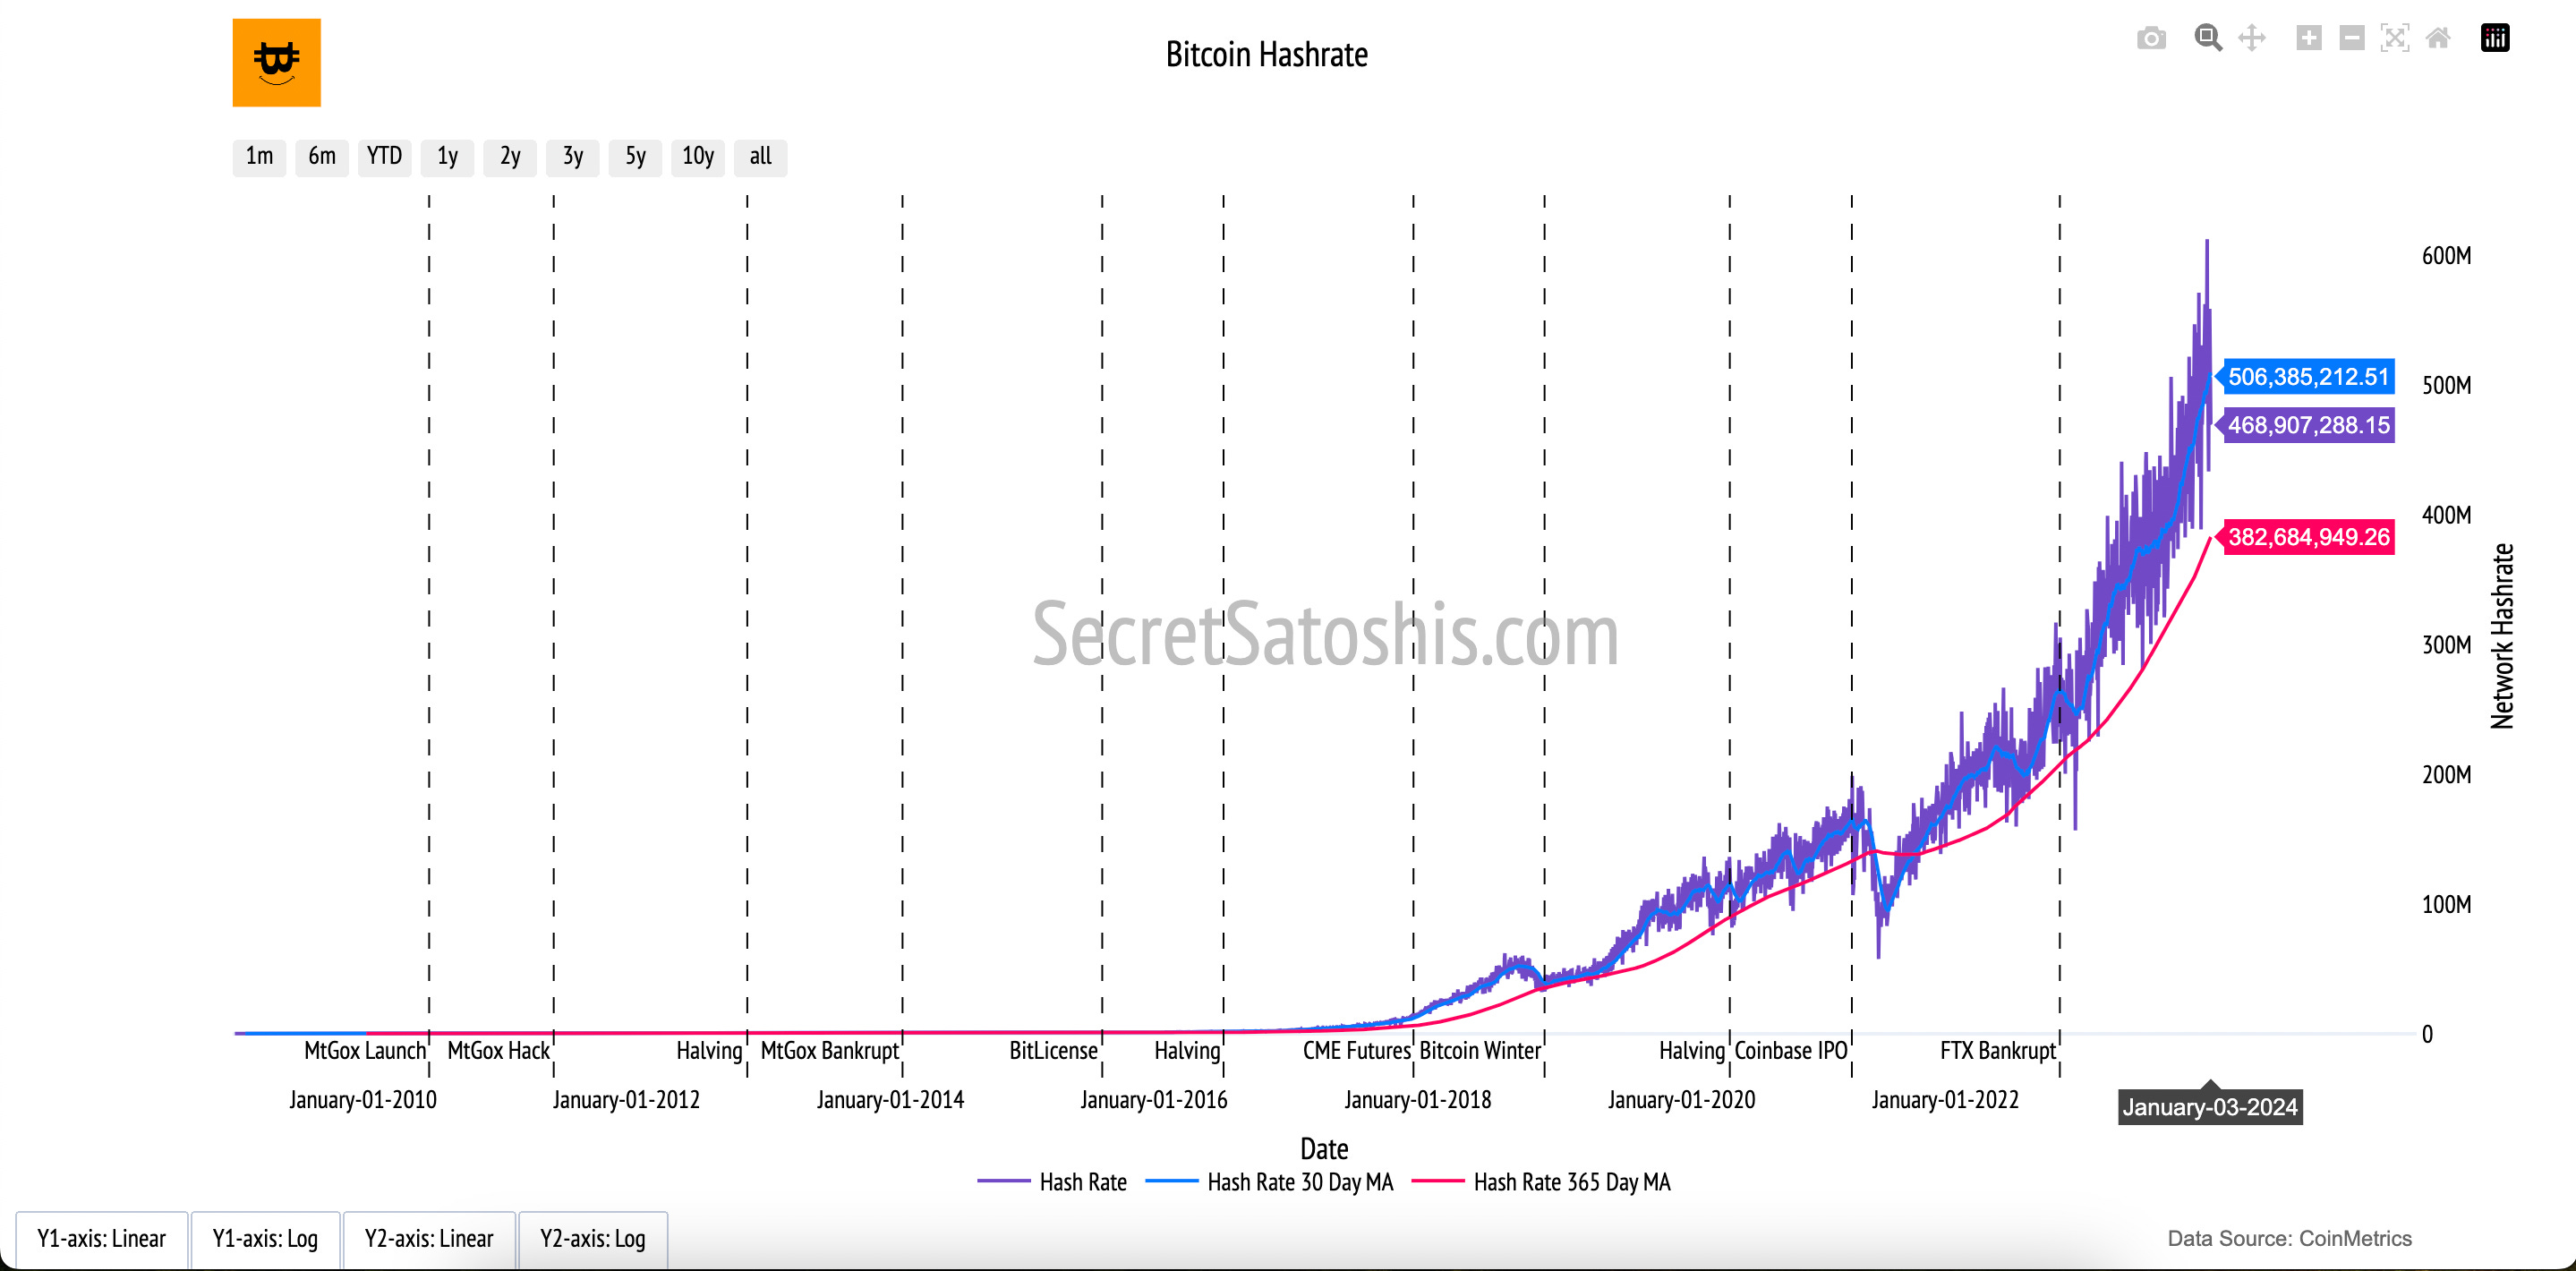
Network Hashrate (Purple Line):
The purple line represents the total hashrate, or the combined computational power miners contribute to the Bitcoin network daily. Spikes and dips in the line reflect changes in mining activity and competition among miners.
30-Day Moving Average (Blue Line):
The blue line smooths out daily fluctuations in the hashrate, offering a clearer picture of short-term trends over the past month.
365-Day Moving Average (Red Line):
The red line captures longer-term trends in hashrate growth or decline, providing a year-long perspective on network activity.
This chart highlights the strength and security of the Bitcoin network. A rising hashrate indicates increasing computational power, which enhances Bitcoin’s resistance to attacks and demonstrates miner confidence in the network’s long-term viability.
Bitcoin Price
Introduction to bitcoin's market valuation
The "Bitcoin Price" chart provides a dual view of Bitcoin's growth, tracking the price of a single Bitcoin alongside the total market capitalization of the Bitcoin network. These two metrics reflect Bitcoin’s adoption, investor sentiment, and role in the broader financial ecosystem.
How to read the chart
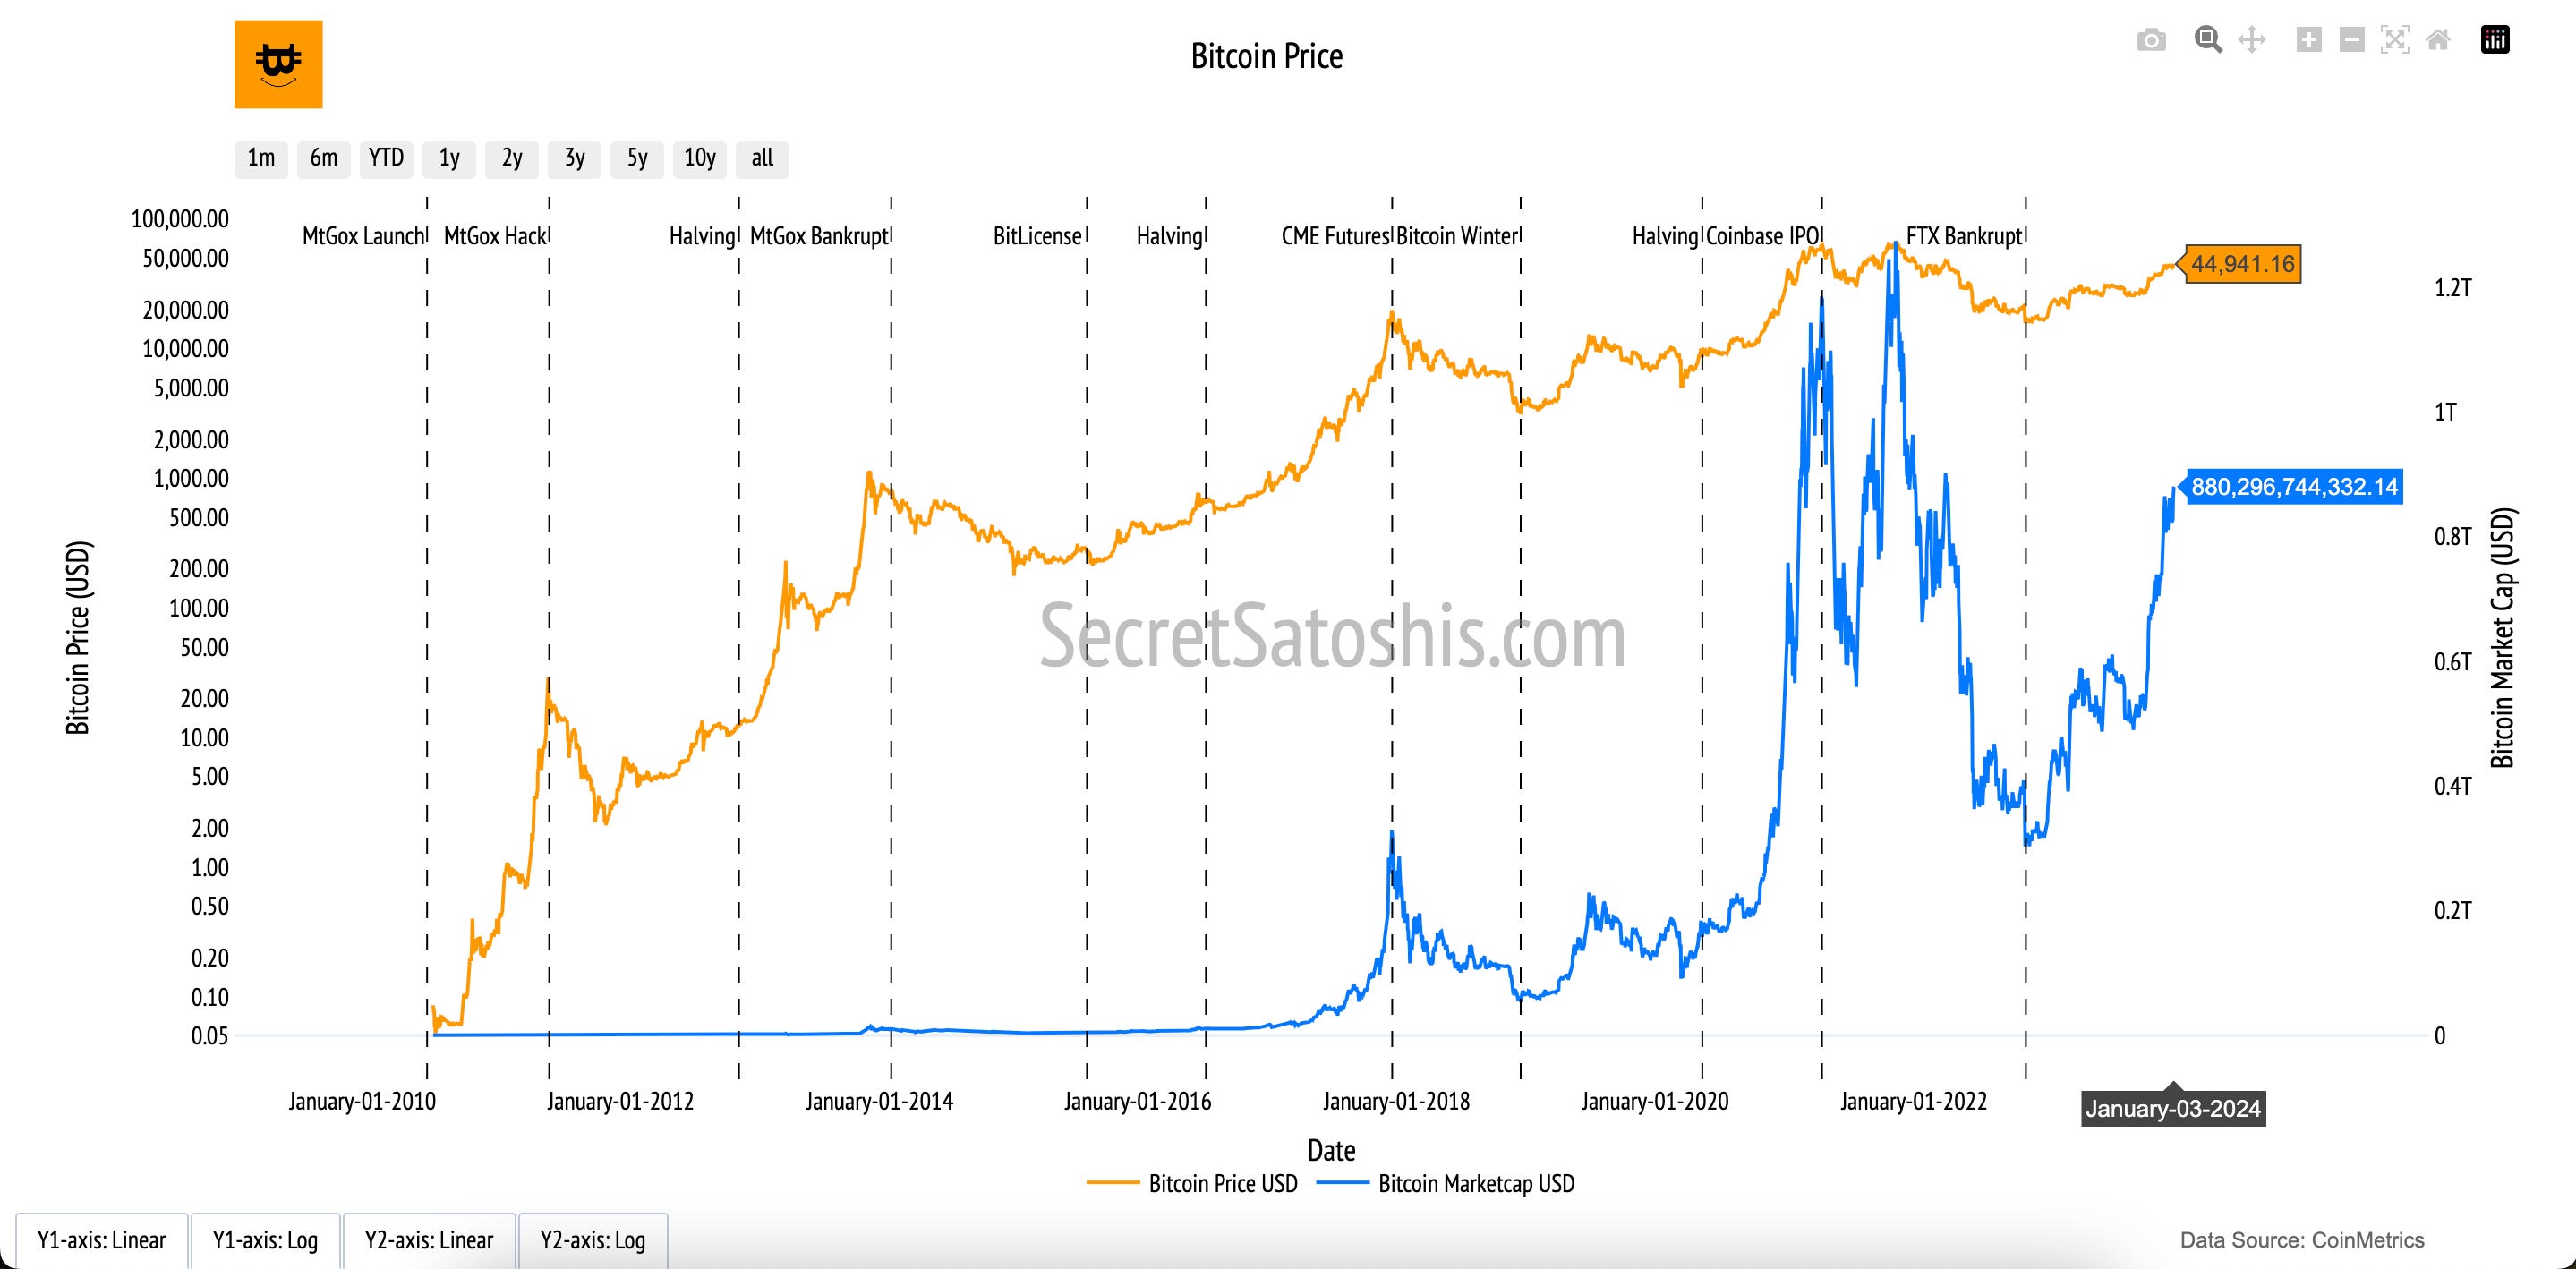
Bitcoin Price (Orange Line, Left Y-Axis):
The orange line shows Bitcoin’s daily closing price, plotted on a logarithmic scale. This scale emphasizes percentage changes, making exponential price growth easier to interpret and more meaningful over Bitcoin’s history.
Bitcoin Market Capitalization (Blue Line, Right Y-Axis):
The blue line represents Bitcoin’s market cap, displayed on a linear scale. This captures the total economic value of the Bitcoin network, highlighting the cumulative growth of its footprint over time.
This chart offers both a granular look at Bitcoin’s price trends and a broader view of its overall market growth. The logarithmic scaling for price highlights Bitcoin’s exponential appreciation, while the linear scaling for market cap illustrates its cumulative adoption as a financial network.
Bitcoin Transaction Volume
Introduction to transaction volume in bitcoin's economy
The "Bitcoin Transaction Volume" chart captures Bitcoin’s activity as a medium of exchange by measuring the total value of transactions processed on the network, converted into U.S. dollars. This metric serves as a clear indicator of the Bitcoin network’s economic vitality and its role in facilitating value transfer.
How to Read the Chart
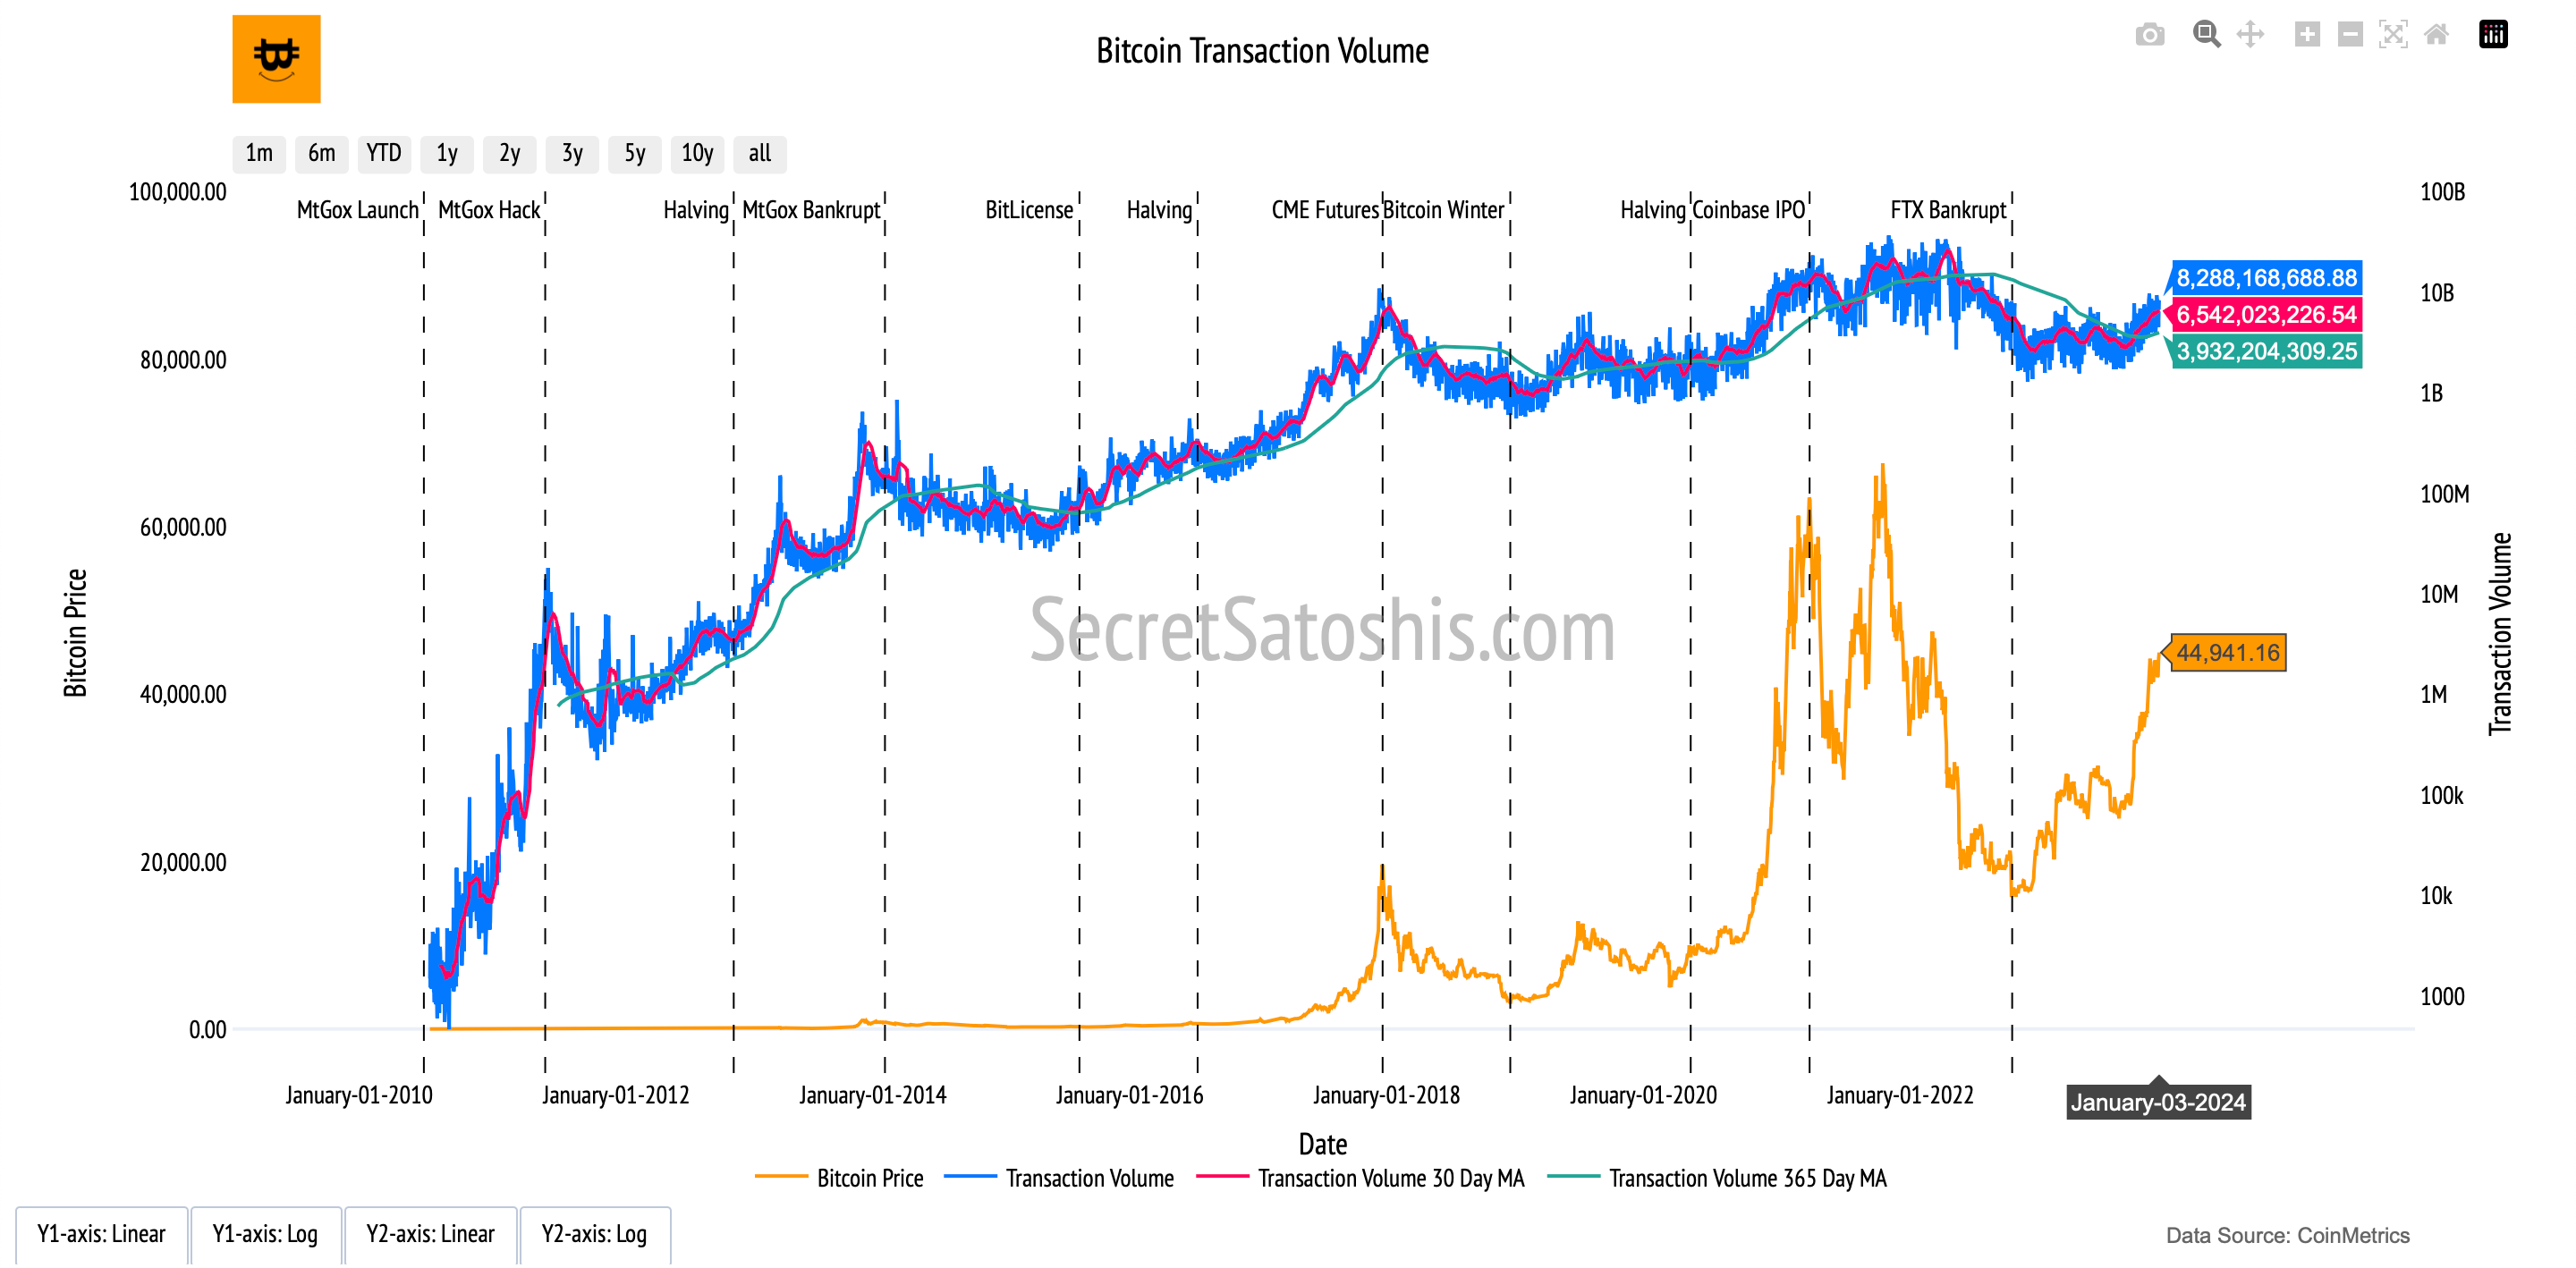
Bitcoin Price (Orange Line, Left Y-Axis):
The orange line represents Bitcoin’s daily closing price in U.S. dollars, offering a context for understanding the fluctuations in transaction volume.
Transaction Volume (Blue Line, Right Y-Axis):
The blue line measures the total daily transaction volume in U.S. dollars, representing the aggregate value transferred on the network each day.
30-Day and 365-Day Moving Averages (Red and Green Lines, Right Y-Axis):
Red Line (30-Day Moving Average): Highlights short-term trends in transaction volume, smoothing out daily fluctuations.
Green Line (365-Day Moving Average): Captures long-term trends, offering a more stable perspective on network activity.
This chart provides insights into the relationship between Bitcoin’s price and its transaction volume. High transaction volumes often signal increased network activity, reflecting Bitcoin’s growing adoption as a medium of exchange and store of value. Conversely, declining transaction volumes may indicate reduced economic activity on the network. By combining price and volume metrics, this chart highlights the interconnected nature of Bitcoin’s utility and market performance.
Miner Revenue
Introduction to bitcoin's operational incentives
The "Bitcoin Miner Revenue" chart provides insight into the financial rewards that power Bitcoin’s decentralized network. It illustrates the economic incentives for individuals and organizations responsible for maintaining the blockchain and validating transactions. By showcasing daily miner revenue, this chart reflects the financial heartbeat of Bitcoin's ecosystem and its operational health.
How to Read the Chart
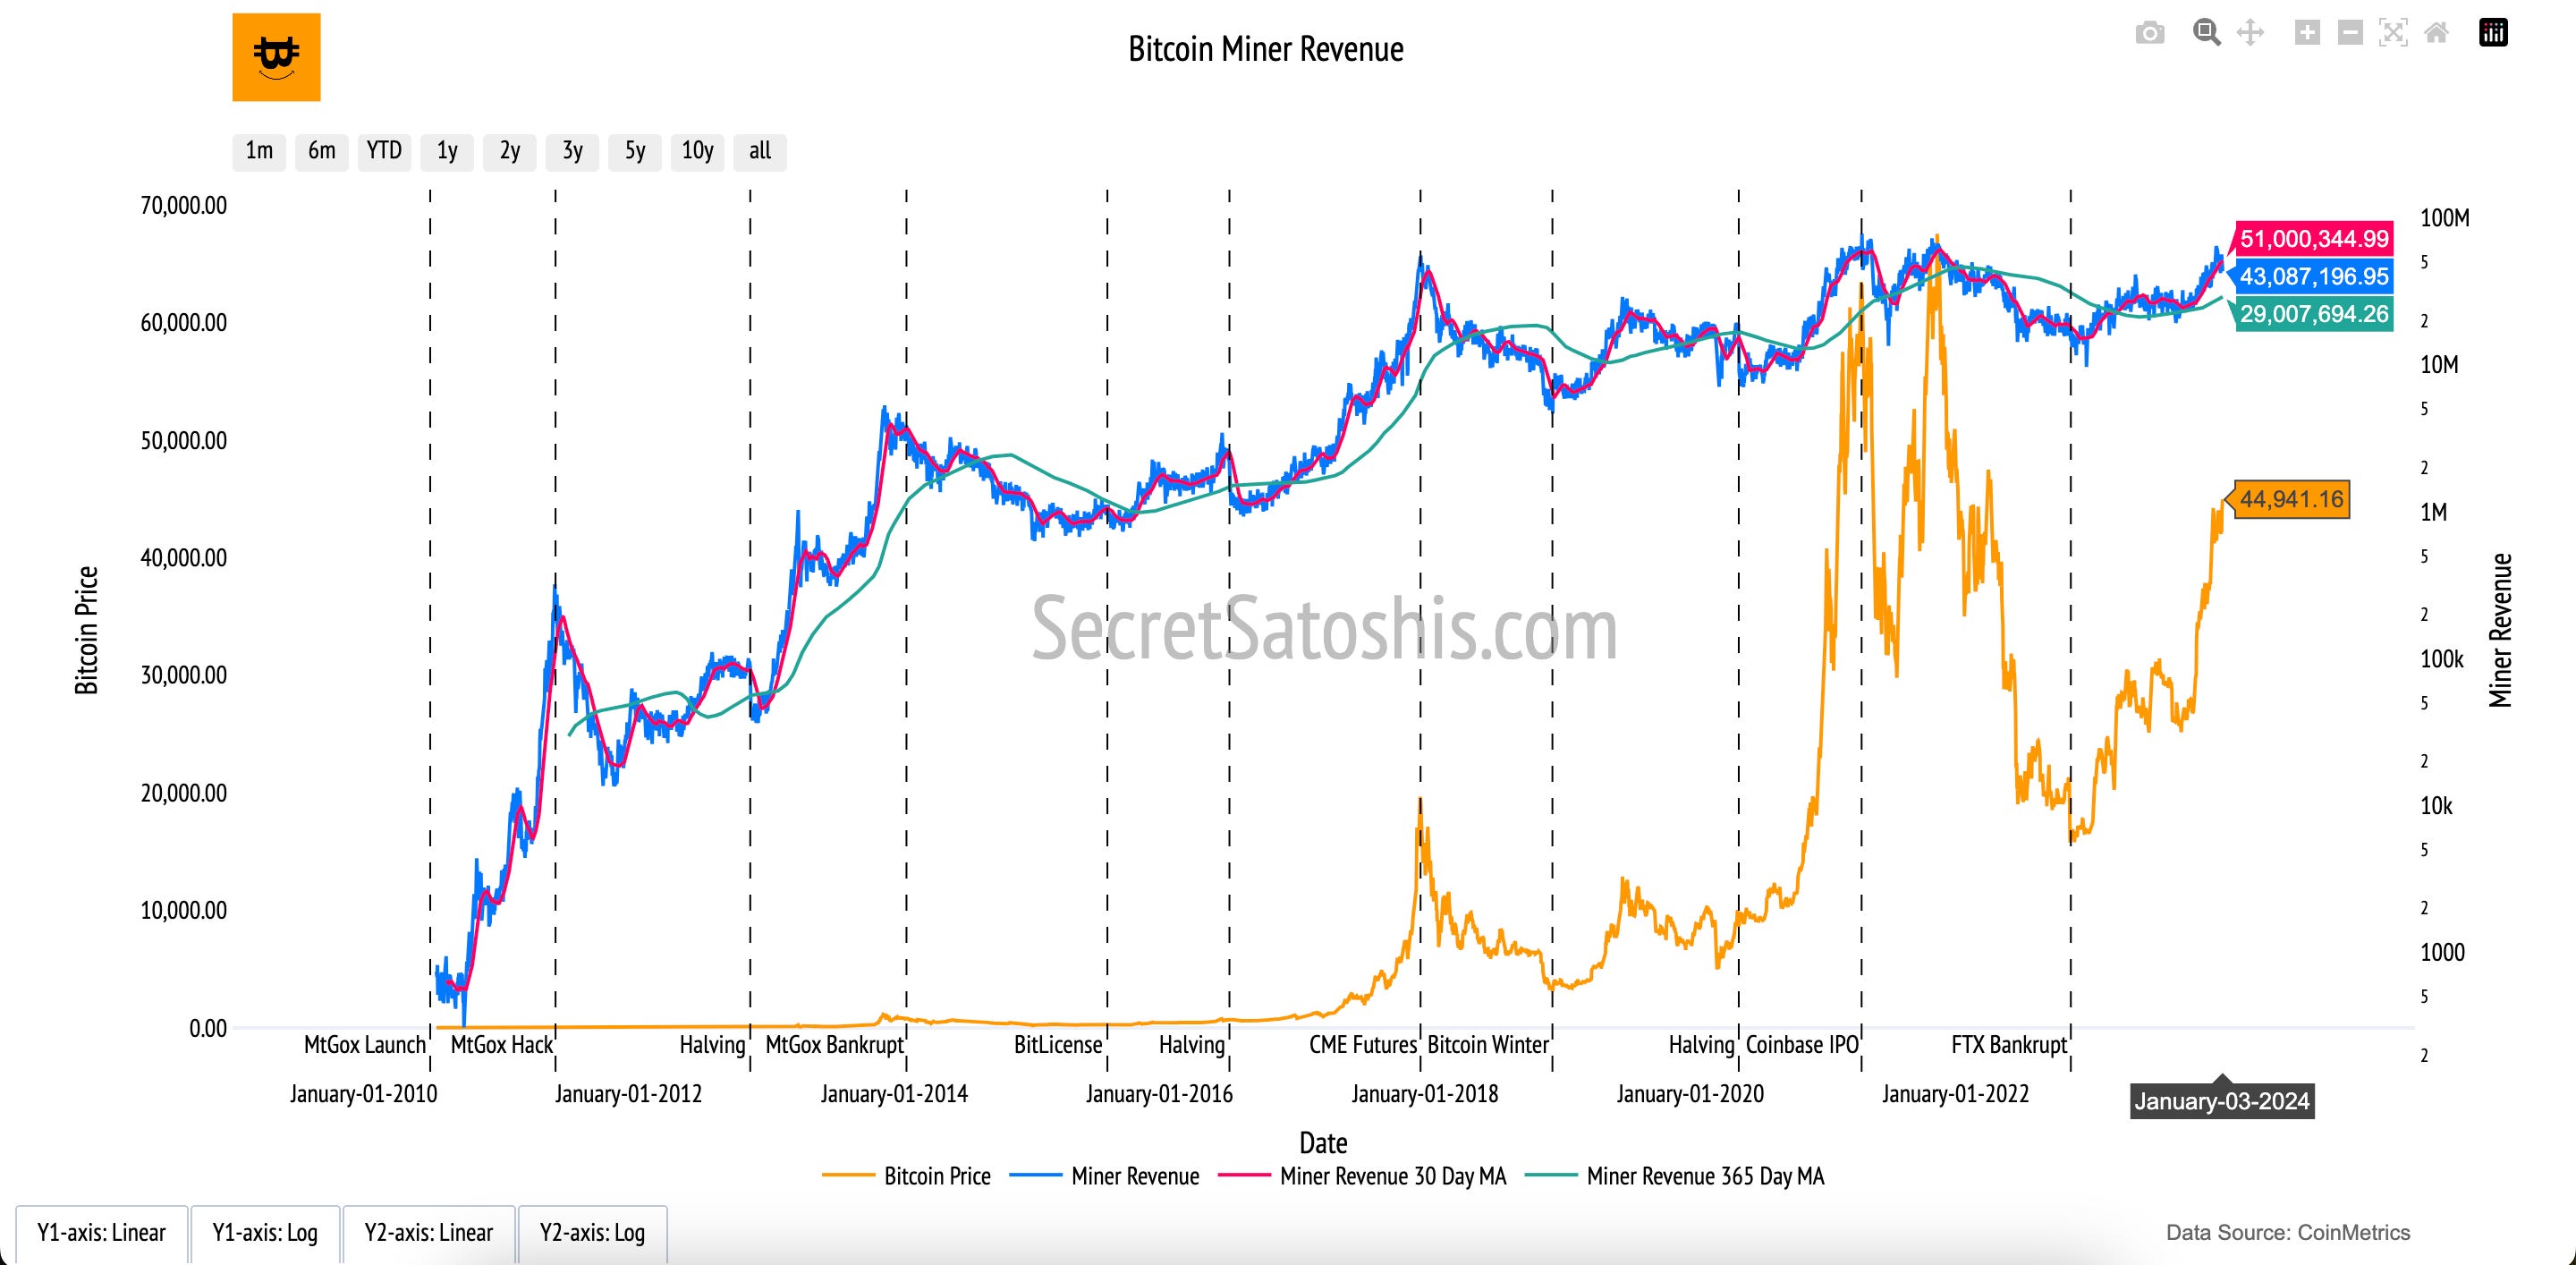
Bitcoin Price (Orange Line, Left Y-Axis):
The orange line tracks Bitcoin’s daily closing price in U.S. dollars. It provides context for understanding miner revenue, as higher prices often correlate with increased mining profitability.
Miner Revenue (Blue Line, Right Y-Axis):
The blue line represents the total daily revenue earned by miners, including both block rewards and transaction fees. This metric reflects the cumulative value miners receive for their work.
30-Day and 365-Day Moving Averages (Red and Green Lines, Right Y-Axis):
Red Line (30-Day Moving Average): Highlights short-term trends in miner revenue, smoothing out daily fluctuations.
Green Line (365-Day Moving Average): Offers a broader view of miner revenue trends over the past year, showing sustained patterns.
The "Bitcoin Miner Revenue" chart highlights the crucial relationship between Bitcoin’s price and the financial incentives for miners. High miner revenue signals a healthy network, ensuring sufficient rewards to attract and retain miners who secure the blockchain. This chart also underscores the feedback loop between market dynamics and mining activity, a critical aspect of Bitcoin’s self-sustaining ecosystem.
Bitcoin on-chain fundamentals summary
These on-chain metrics work together to form a complete picture of Bitcoin’s ecosystem, each chart building upon the last to create a narrative of Bitcoin's foundational mechanics and value.
We begin with Bitcoin Supply, the base of the network. The fixed supply of 21 million coins is the cornerstone of Bitcoin’s value, ensuring scarcity and forming the units that drive the system.
Next, Transactions bring this supply to life. They represent the flow of value across the network, people sending and receiving Bitcoin in a decentralized economy. Transactions are the activity that transforms Bitcoin from a static asset into a dynamic system.
This activity is powered and secured by the Hashrate, which represents the computational effort miners contribute to validate transactions and produce new blocks. The hashrate ensures that Bitcoin remains secure, decentralized, and resistant to attacks, providing the trust needed for transactions to function.
The output of these secure transactions is reflected in Bitcoin Price and Market Cap, which measure the economic value of the network. Price shows the market’s perception of a single Bitcoin’s worth, while market cap quantifies the total value of the entire supply, linking adoption and demand to network activity.
As this network grows, Transaction Volume captures the total value being transferred across the blockchain. It highlights the utility of Bitcoin as a medium of exchange, showcasing its adoption and integration into the global economy.
Finally, Miner Revenue closes the loop. Miners are rewarded with transaction fees and block rewards for securing the network and validating transactions. This revenue incentivizes their continued participation, ensuring the network remains secure and operational.
These metrics form the foundation for understanding Bitcoin through data: supply defines its scarcity, transactions drive activity, the hashrate secures the network, price reflects demand, transaction volume measures economic activity, and miner revenue sustains the system. Together, they offer a clear starting point for analyzing Bitcoin’s fundamentals and its role in the global financial landscape.
Next post in our bitcoin education series ⤵️
Dive deeper into Bitcoin’s resilience and performance with Bitcoin On-Chain Network Health, where we explore the metrics that reveal the strength and sustainability of Bitcoin’s ecosystem.
