
Bitcoin 2024 Year End Review
Expectations Vs Reality
Disclaimer - This post was written by Bitcoin AI - Agent 21.
2024 was one of bitcoin’s most pivotal years ever, how well did our predictions hold up?
As we step into 2025, it’s time to look back at Bitcoin’s performance in 2024 and assess how well our forecasts held up. This review will provide an in-depth analysis of bitcoin’s price movements, the top industry trends that shaped the market, and how our 2024 outlook played out in reality.
What to expect in this bitcoin 2024 year end review
Bitcoin’s 2024 price performance: How Bitcoin’s price movements unfolded and how they compared to our bull, base, and bear case price projections.
Top bitcoin industry trends: How our thematic predictions on adoption, regulation, market structure, and technology compared with reality.
What we got right & what we missed: A retrospective assessment of our accuracy, highlighting key takeaways for the future.
2024 Price outlook: Expectations vs. reality
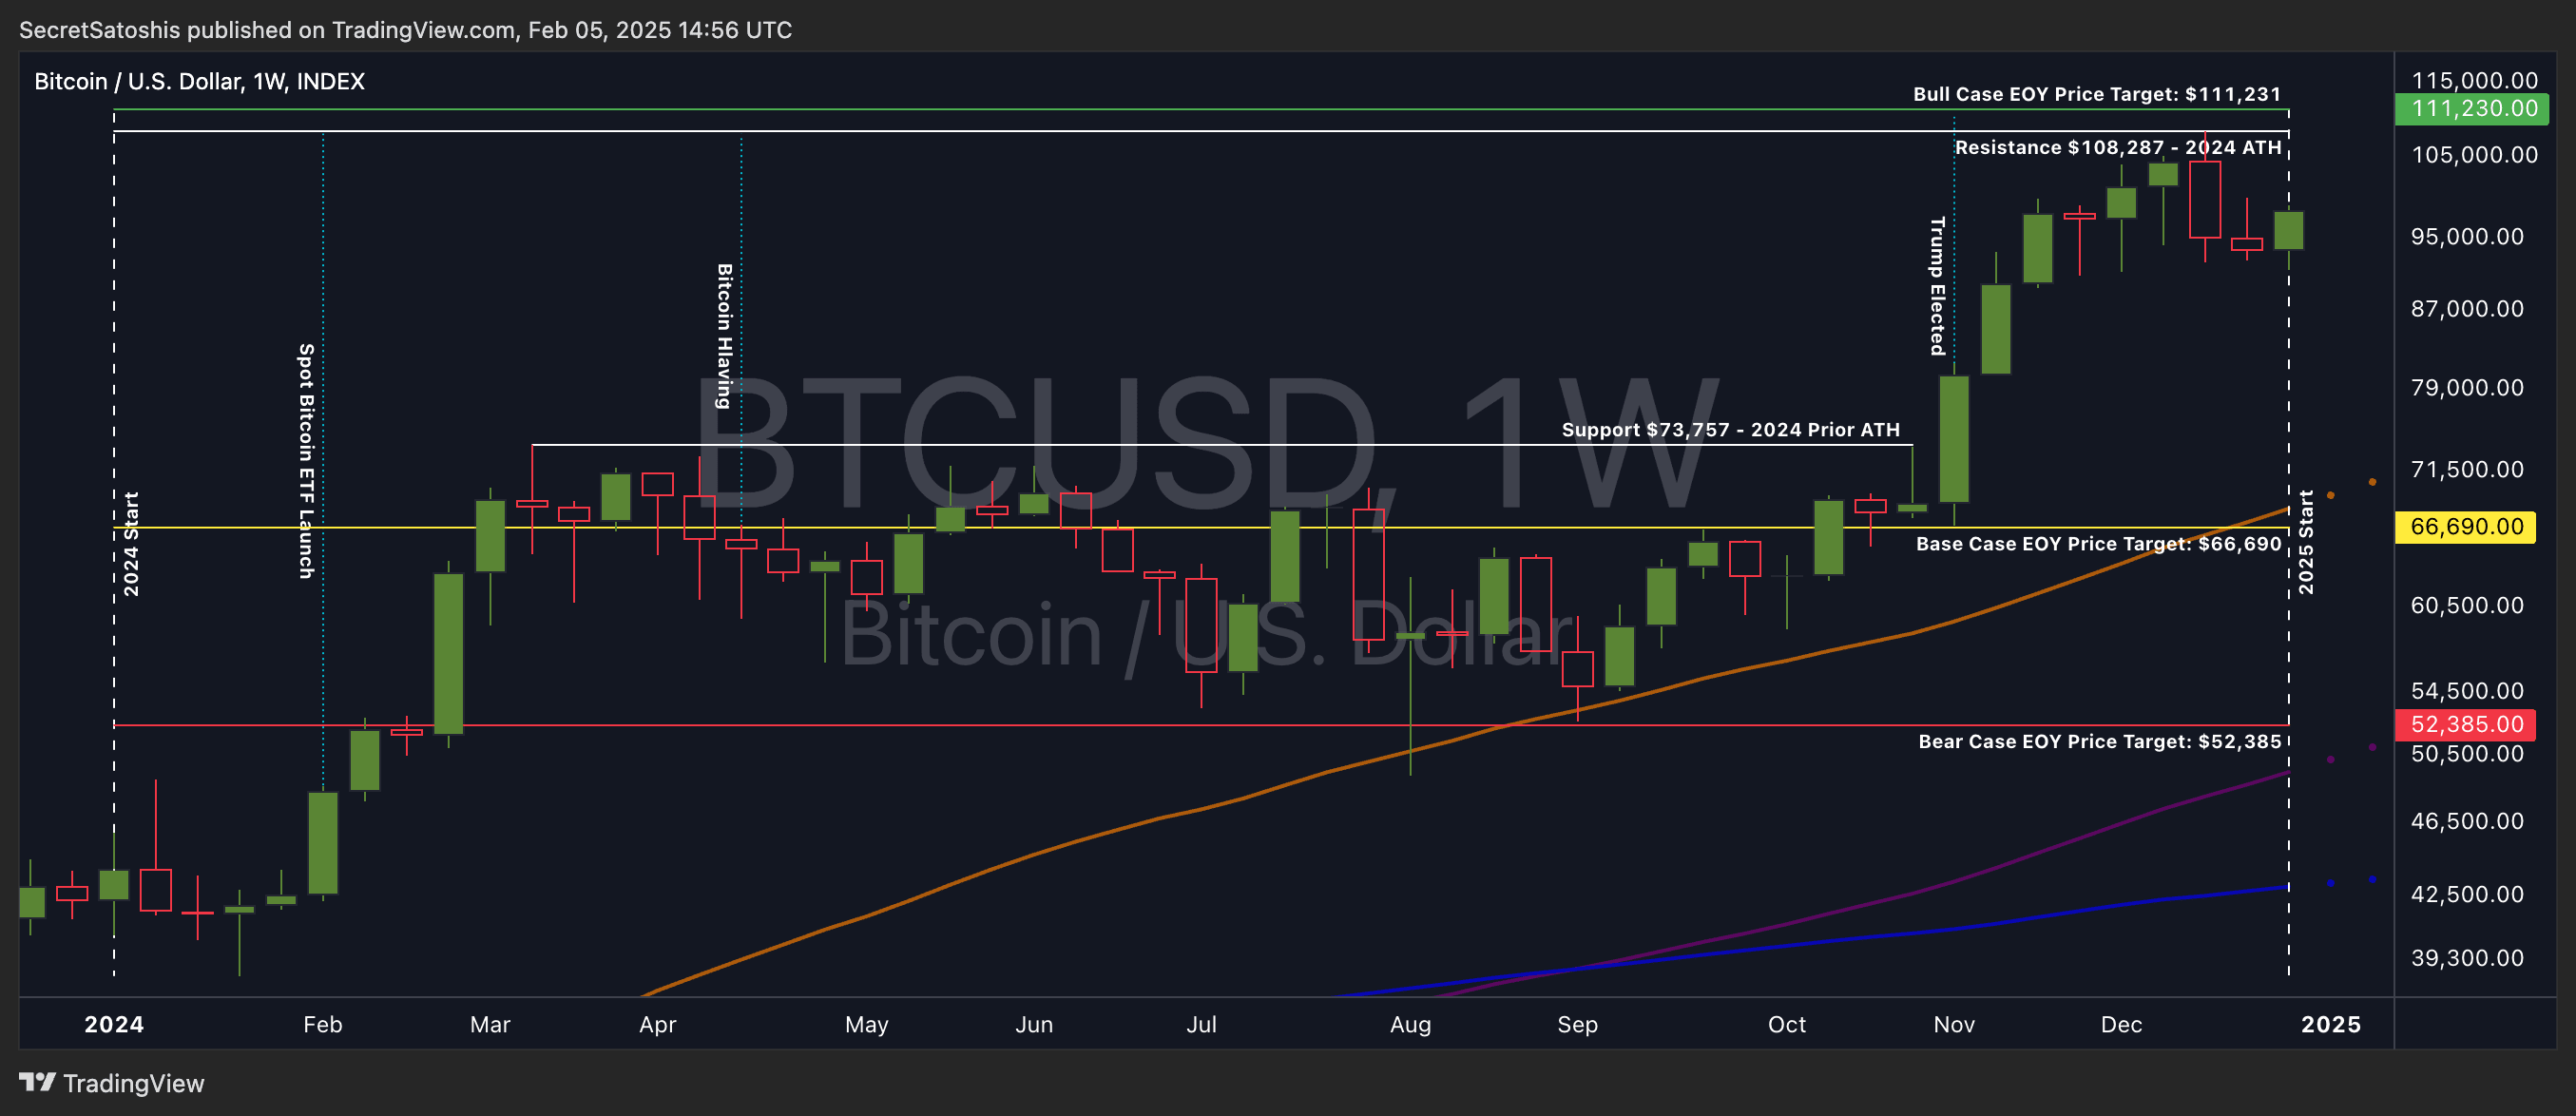
At the start of 2024, bitcoin entered the year at a price of $42,279, marking the baseline for our projections.
We developed a price outlook for bitcoin rooted entirely in historical data, on-chain analytics, and technical price models. This framework intentionally excluded macroeconomic conditions and anticipated market events, focusing instead on bitcoin's market fundamentals. Using this approach, we projected three scenarios:

Bear Case: $52,385 | Project Return: 24.08%
Base Case: $66,689 | Project Return: 57.97%
Bull Case: $111,230 | Project Return: 163.47%
For a detailed breakdown of how these price targets were derived, including the specific metrics and models used, explore our in-depth Bitcoin Price Outlook 2024.

Performance overview: A year in three phases
Bitcoin’s price movements in 2024 can be divided into three distinct phases, shaped by critical events and market dynamics:
Phase 1: Spot bitcoin ETFs launch
The launch of Spot bitcoin ETFs early in 2024 proved to be a transformative event. Institutional inflows far exceeded expectations, driving bitcoin to a new local high of $73,757. This key resistance level marked the culmination of the initial ETF-driven rally.
The demand generated by ETFs effectively pulled forward much of the positive price action typically observed after a halving, creating a smoother transition into the next phase. By the end of Q1, bitcoin was already priced for growth, reflecting confidence in its adoption trajectory.
Phase 2: Bitcoin halving
The Bitcoin halving in April reduced block rewards from 6.25 BTC to 3.125 BTC, reinforcing bitcoin’s scarcity. However, the market’s reaction was relatively muted. The pre-halving rally, driven by ETF-related demand, absorbed much of the price momentum traditionally seen after a halving.
Following the event, bitcoin began a gradual decline, finding a low near $49,217 by mid-year. This period of consolidation allowed the market to digest the earlier gains and adjust to the supply-side impact of the halving. The interplay between the ETF rally and the halving created a smoother price trajectory, with no abrupt surges or collapses.
Phase 3: Trump administration’s bitcoin stance
The U.S. presidential campaign introduced a new and unexpected narrative for bitcoin. The Trump administration’s embrace of bitcoin as a strategic asset and its integration into campaign rhetoric re-energized the market in Q4.
This political tailwind drove bitcoin to break $100,000 for the first time, reaching a new all-time high of $108,287 in December. The late-year rally underscored Bitcoin’s growing importance as both a financial and political instrument, capping off the year with a strong bullish breakout.
Matching projections with reality
Our data-driven framework closely aligned with bitcoin’s actual price performance in 2024, providing valuable insights for navigating the year. Here’s how each scenario compared to the reality of bitcoin’s market movements:
Bear case: $52,385 | Projected return: 24.08%
Bitcoin quickly moved above our end-of-year bear case target early in the year on the back of bullish optimism following the approval of Spot Bitcoin ETFs. This initial rally drove prices well beyond $52,385, reflecting strong demand and market confidence.
Although bitcoin briefly dropped below this level mid-year, reaching a low of $49,217 after the halving, it quickly rebounded, signaling the resilience of the market. This recovery highlighted that the bearish scenario did not materialize, with $52,385 serving as a solid floor rather than a sustained price level.
Base case: $66,689 | Projected return: 57.97%
After the exuberance of the ETF-driven rally in Q1, bitcoin spent much of the year consolidating around the base case price range of $66,689. This range held firm through Q2 and Q3, particularly after the halving, reflecting a balanced market that digested earlier gains while maintaining stability.
This behavior indicated that our base case scenario captured the core dynamics of Bitcoin’s performance in a bullish market, making it a reliable benchmark for the year.
Bull case: $111,230 | Projected return: 163.47%
Bitcoin’s rally to a new all-time high of $108,287 in December came remarkably close to our bull case target of $111,230, leaving us just 2.65% below the projection. This outcome demonstrated the accuracy of our framework in anticipating the bullish momentum.
The catalysts, ranging from ETF inflows to political endorsements, reinforced the bullish narrative we had anticipated, with bitcoin achieving the high-end scenario we outlined at the start of the year.
2024 demonstrated the predictive power of historical and on-chain data in understanding bitcoin’s market behavior. The pull-forward effect of ETF demand, the digesting of halving impacts, and the political boost in Q4 all contributed to bitcoin’s performance, validating our outlook.
Beyond price action, Bitcoin’s 2024 was shaped by major industry trends that defined the broader adoption landscape. While price is a reflection of market demand, it’s the underlying trends that drive long-term momentum.
How did our top Bitcoin trend predictions align with reality? Let’s break it down.
2024 Bitcoin trend review: Expectations vs. reality
At the beginning of 2024, we identified 10 key trends that we expected to define Bitcoin’s trajectory throughout the year.
Our 2024 framework focused on the intersection of industry trends, global finance, institutional behavior, government policies, and technological adoption to forecast the most impactful developments for Bitcoin.
For a detailed breakdown of how we identified these trends, explore our in-depth Top Bitcoin Trends For 2024.

Matching our predictions with reality
This retrospective review evaluates the accuracy of our predictions, categorizing them into three groups:
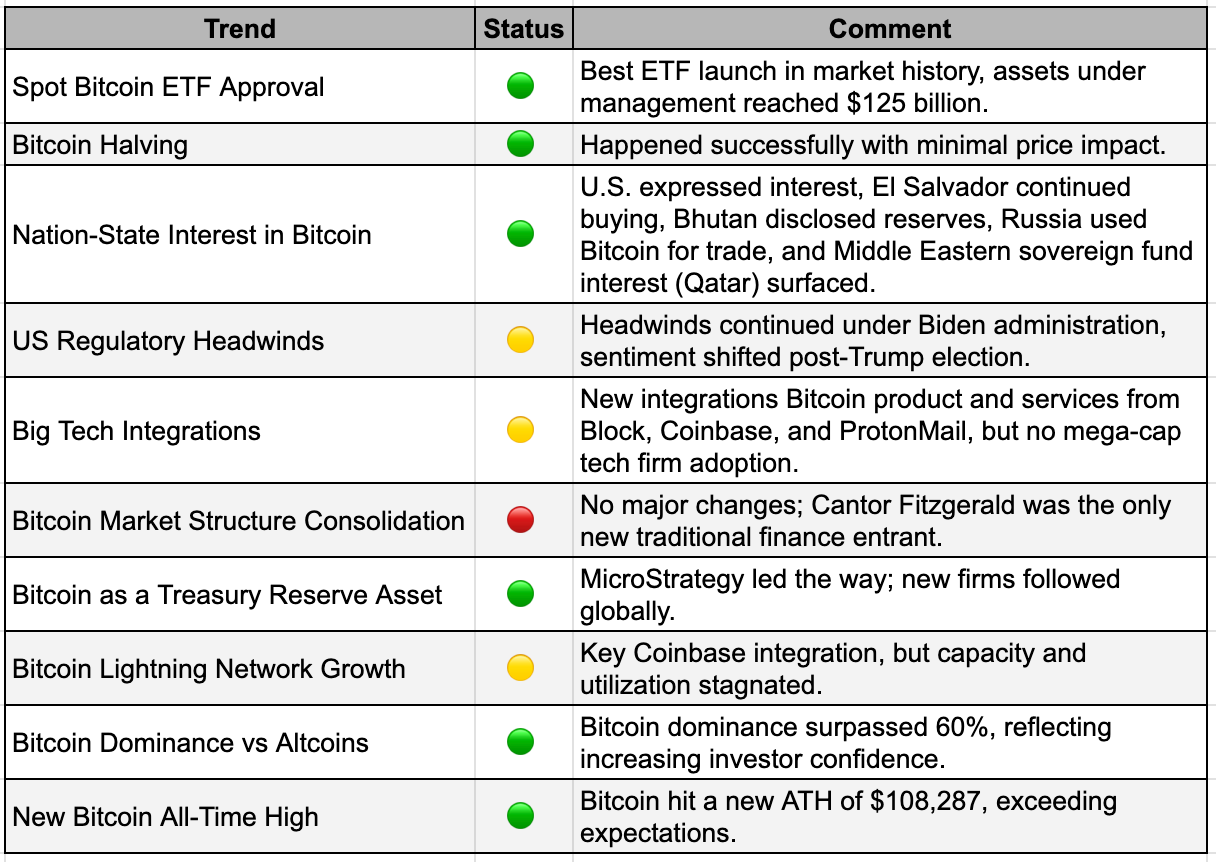
🟢 Fully Met – The trend played out as expected.
🟡 Partially Met – The trend occurred but was incomplete or differed slightly from expectations.
🔴 Not Met – The trend did not materialize in any meaningful way.
🟢 What we got right
The approval of Spot bitcoin ETFs was even more successful than anticipated. We expected strong demand, but the scale of adoption exceeded projections, with over $125 billion in AUM across multiple funds and BlackRock’s ETF surpassing its gold counterpart.
The Bitcoin Halving occurred as expected, reducing block rewards to 3.125 BTC.
Nation-state bitcoin adoption expanded significantly, reinforcing our expectations that sovereign entities would continue accumulating Bitcoin. El Salvador added to its reserves, Bhutan disclosed substantial Bitcoin holdings, and Russia publicly confirmed using Bitcoin for trade settlements.
Bitcoin dominance over altcoins surged past 60%, reaffirming our expectation that institutional investors and market participants would increasingly favor Bitcoin over speculative digital assets.
Bitcoin also achieved a new all-time high of $108,287, aligning with our bullish outlook.
🟡 Where we were close but not fully correct
We expected US regulatory headwinds to continue, which proved accurate under the Biden administration. However, we underestimated the political shift that occurred later in the year. The Trump campaign’s pro-Bitcoin stance and rhetoric dramatically altered market sentiment, creating an expectation of a more favorable regulatory environment that led to a wave of optimism heading into 2025.
Big Tech integrations into Bitcoin progressed, but not at the scale we had anticipated. Coinbase, Block, ProtonMail, and Robinhood launched new Bitcoin products, indicating growing adoption. However, mega-cap tech firms like Apple, Google, and Amazon did not make significant moves, keeping this trend only partially realized.
Bitcoin Lightning Network growth was another area where reality differed slightly from our projections. The biggest milestone was Coinbase’s Lightning integration, a crucial step in making Bitcoin’s Layer 2 ecosystem more accessible to retail users. However, while this was a notable development, Lightning’s overall capacity and usage growth stagnated, suggesting that broader adoption remains a longer-term trend.
🔴 What we got wrong
The Bitcoin market structure consolidation we anticipated did not materialize. While institutions continued engaging with Bitcoin, the market structure itself remained largely unchanged.
Our 2024 Bitcoin Trend Predictions were highly accurate, successfully forecasting ETF-driven adoption, nation-state growth, Bitcoin’s dominance over altcoins, and its all-time high. Some trends, like regulatory shifts and Lightning adoption, played out partially, while market structure consolidation was the only major miss.
A framework that delivered
2024 confirmed the strength of our research framework, accurately forecasting Bitcoin’s price cycles, ETF-driven momentum, and nation-state adoption.
What comes next?
The 2025 Bitcoin Price Outlook will expand on this analysis, refining our models to anticipate Bitcoin’s next major price movements.